

Welcome to another edition of the Decode Newsletter. This issue is out of sync with our usual schedule, however it’s been a long, painful and boring downtrend in Bitcoin, and that appears to have come to an end. It’s therefore only fitting that I get straight to my desk and start writing.
I’ve been very clear in the last few newsletters about the levels that would satisfy my requirements to be able to confidently call the bottom. First a reclaim of 66.7k, and then a further reclaim of 74k, puts price above 4 day supertrend, both the 200 day sma and ema, and all downsloping trendlines. At time of writing Bitcoin is sitting around 77k having sliced through major resistances like a hot knife through butter. There is no doubt this is a big move with strong potential to reverse the trend.
After 10+ months of downtrend, the major point of discussion in the crypto community is whether this finally spells the end of the 4 year cycle. Regular readers will know that the 4 year cycle is not a major part of our analysis, although we do touch on it from time to time, and today we will definitely discuss it alongside the business and liquidity cycles, and because I believe the bottom is now in, we will try to neatly wrap that all up.
In the last issue I said we would focus on Elliott Wave and a range of altcoins next, but because this is something of an interim special edition, we do need to cover the most pertinent market events first. However, I will try to do that some justice, covering the broader crypto market positioning as well, and then that focus can remain for future issues as the crypto market looks set to rise.
Exciting times ahead, so let’s get straight into it…
Bitcoin
Bitcoin looks good here, and first I'll cover Supertrend and show you why 4 day Supertrend alongside RSI is one of the final technical confirmation signals I was looking for.
Supertrend
When I first discussed 4 day supertrend it was at 74k, but has since fallen to 72k. In all but one of Bitcoin's prior cycles, a break of 4 day supertrend resulted in the start of a new bull market.
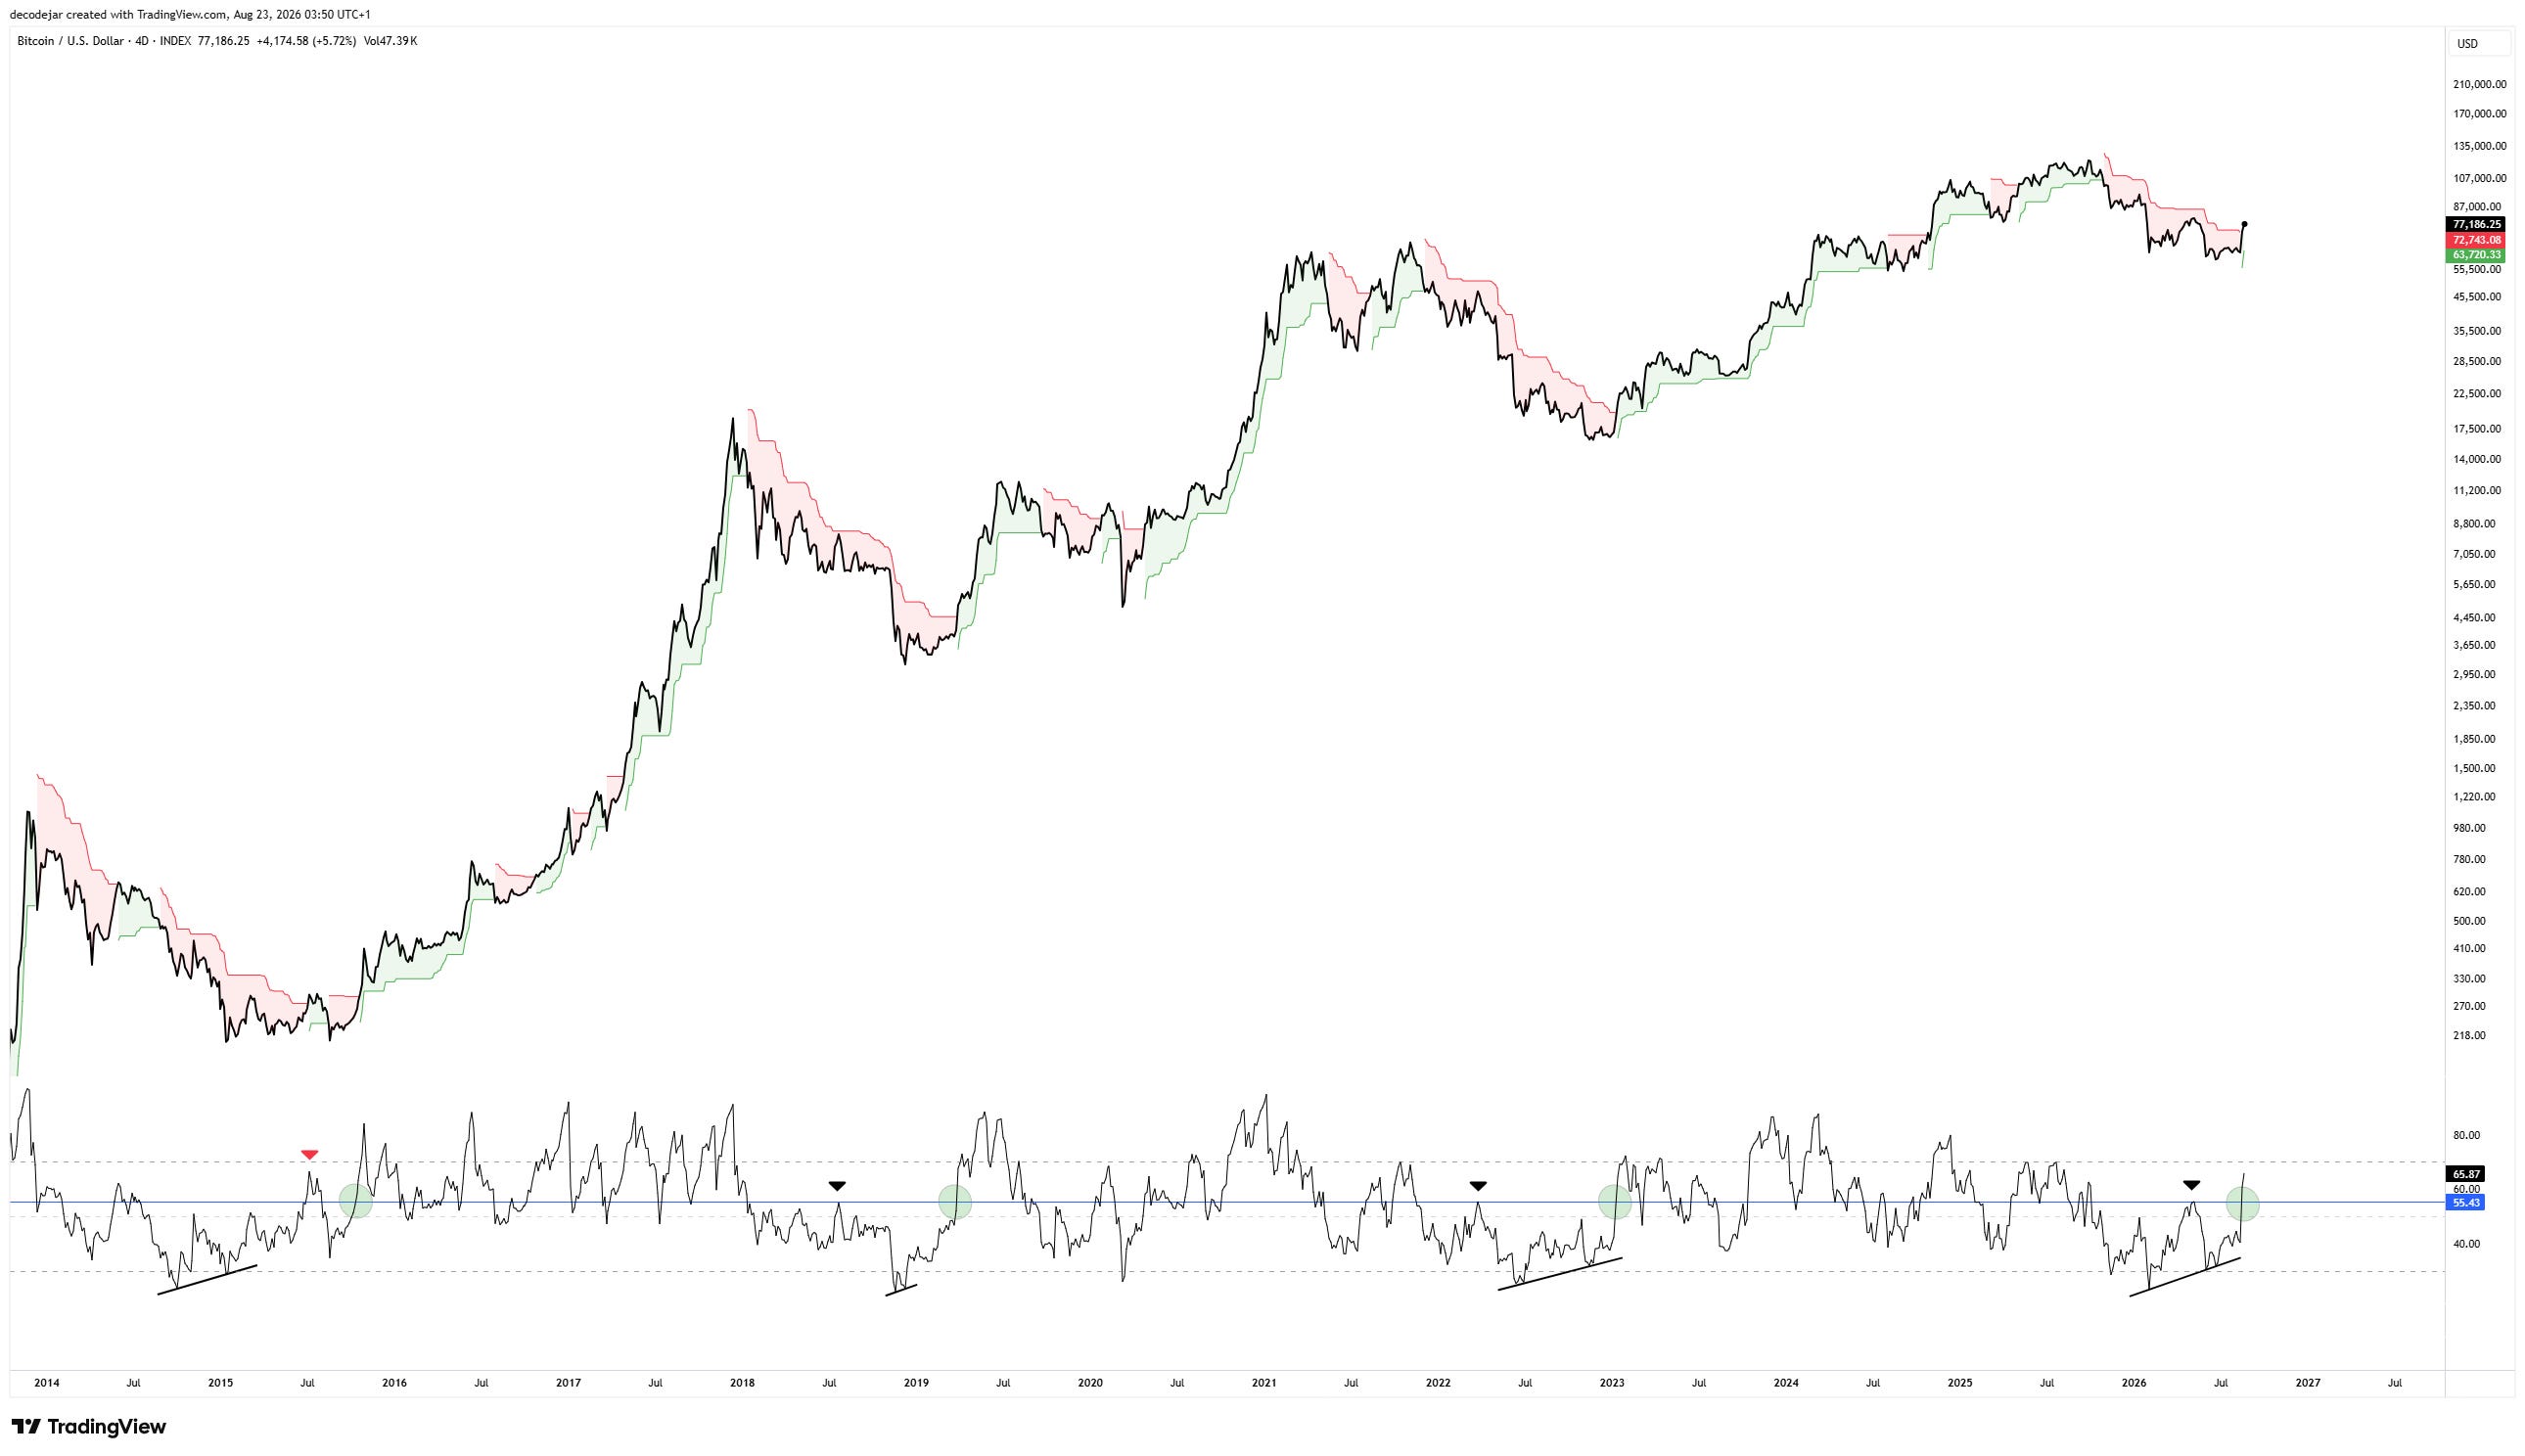
In 2014 the trend broke early to fake out in a classic B-wave or bear market rally, but without bullish divergence on the RSI, and then rolled back over. That same bear market continues to be the anomaly in the data, with a fakeout in July 2015 as well, before making new lows on some exchanges.
So if this early cycle defeats my point of view, then why leave it on the chart? First, I won't exclude something that doesn't fit my bias, but second, the bear market rally occurred within 6 months of the top, not after 10 months and down at the 200 week sma. In addition, the fakeout at the lows was primarily caused by the Bitfinex flash crash that came a little later, when cascading liquidations crashed the price, which is why new lows were only printed on the Bitfinex chart (and therefore the index) but not anywhere else.
Looking at more contemporary cycles, the 2018 and 2022 bear market trends are uninterrupted on 4 day supertrend, with a fakeout occurring at RSI 55 before bullish divergence is fully formed.
If you look at 3 day supertrend, the 2018 fakeout pierces the downtrend, making it a less reliable signal, and with a level currently at 70k it aligns with many of the other technical signals I mentioned in the intro, such as the 200 day, but does not tell us that price has moved significantly above them.
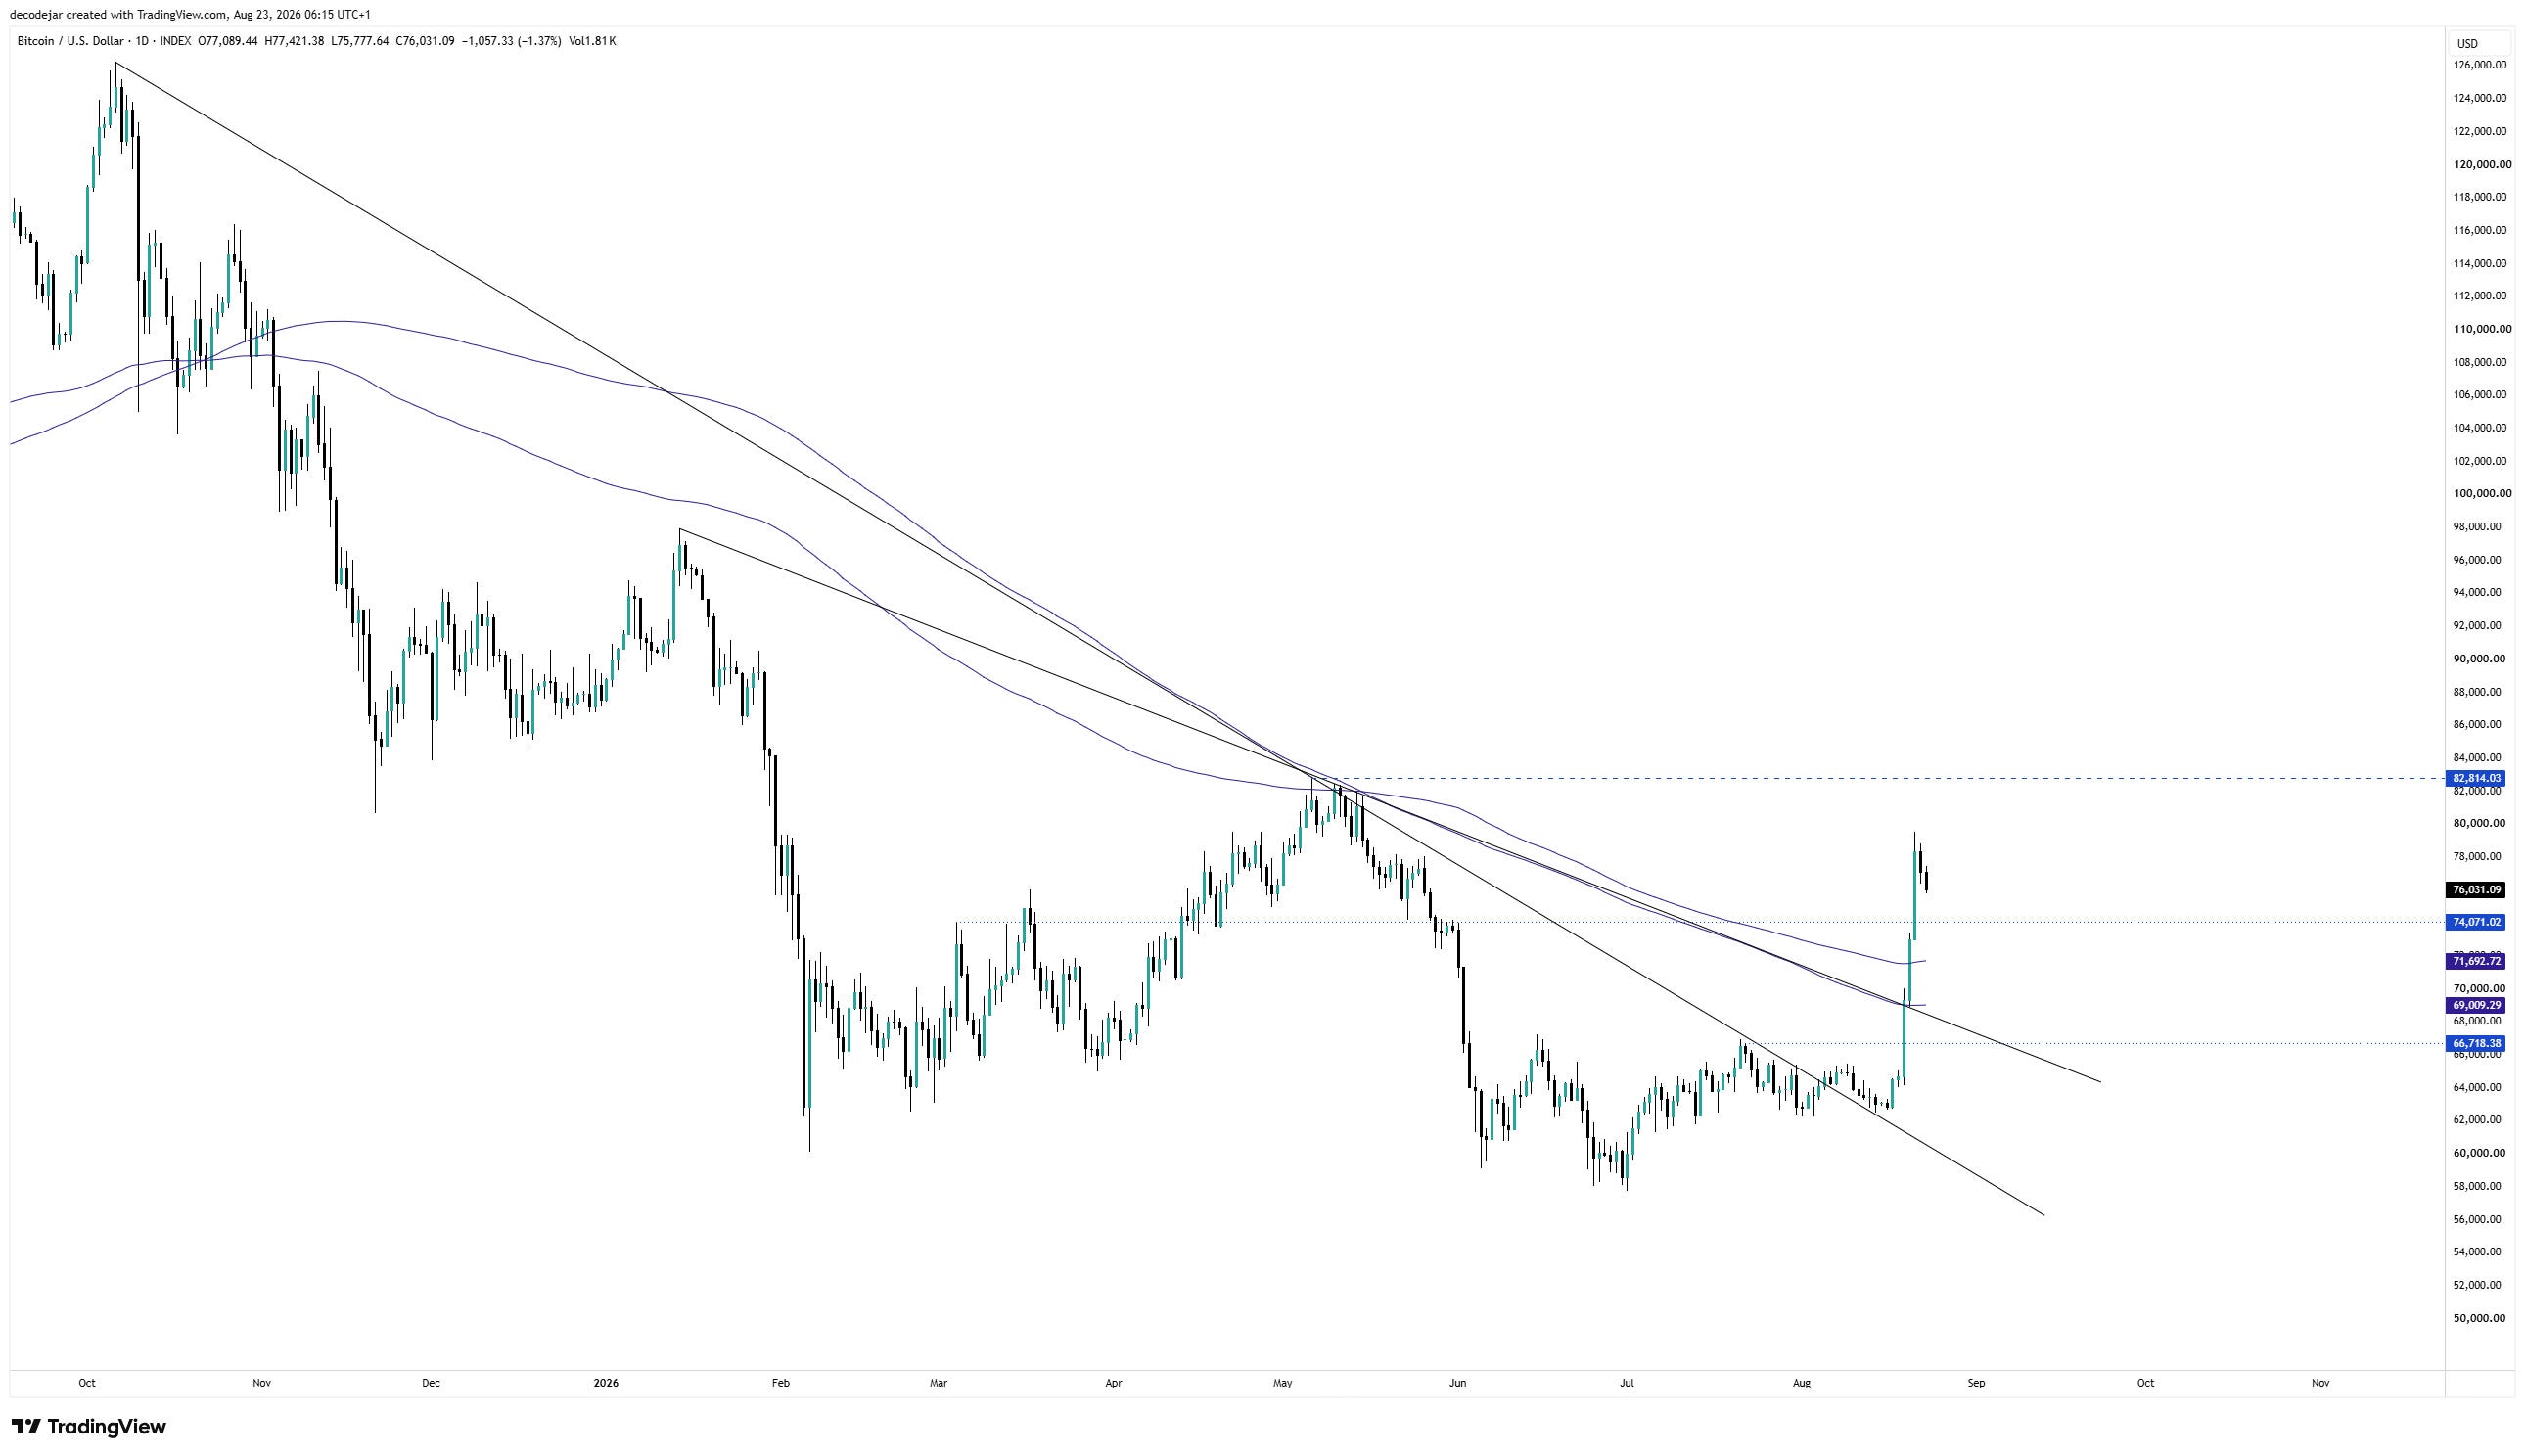
Back at 4 day supertrend then, Bitcoin has made a strong breakout above all but one of the major resistances, has broken above 55 on the RSI, and we have a clear reliable signal for trend reversal. I expect Bitcoin to consolidate in the mid 70s for now, before continuing higher to print the final requirement, a macro higher high above 82.8k.
Elliott Wave
Looking at our primary count, 5 waves up with an ending diagonal, has given way to what I still consider to be a somewhat awkward, albeit valid, WXY correction down to 57.8k for a perfect tap at the 0.618 Fibonacci retracement.
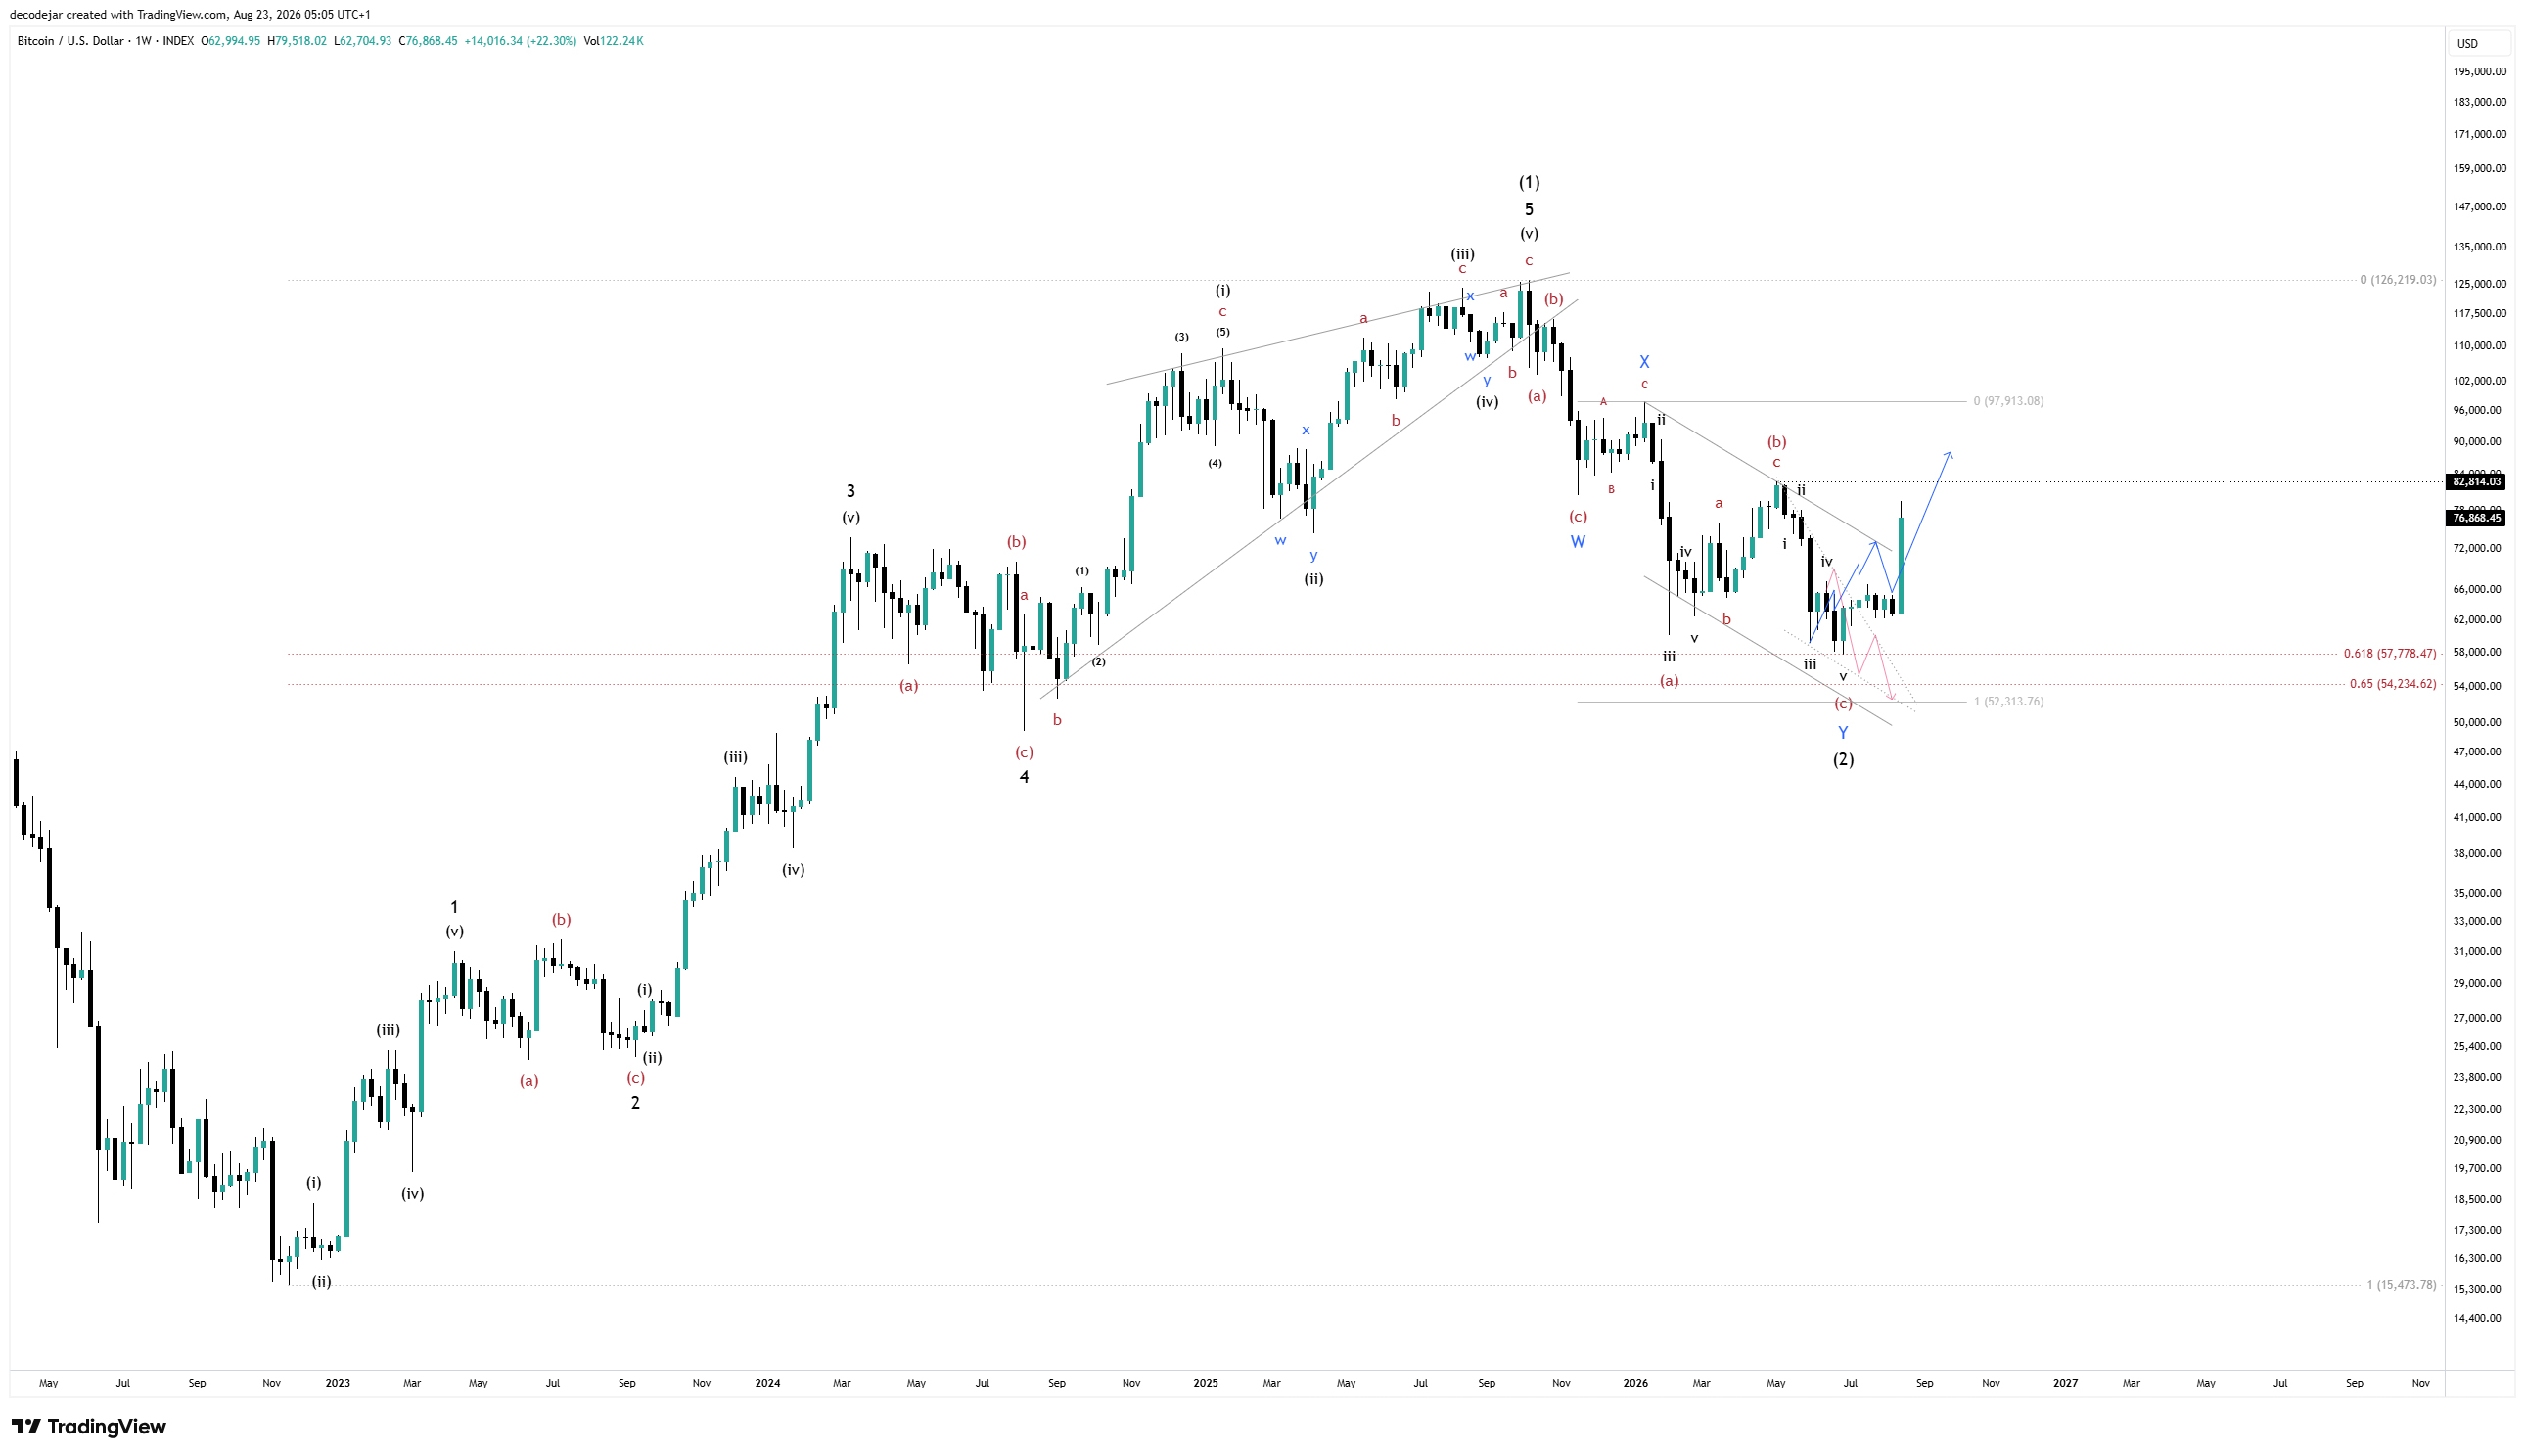
At the June lows, we considered two paths forward for Bitcoin. First a bounce and then a red path taking us lower back down into the 50-60k support band, or ‘The Buy Zone’ as I have been calling it. Second a blue path representing a rally back to the top of the channel, before a correction and then continuation higher.
Bitcoin of course doesn’t care about my squiggles, and took a path somewhere in the middle, initially following the red path lower, before catching up to the more bullish outcome. Squiggles aside, what is most important is that price has convincingly resolved in one direction, and in this case that is to the upside.
To be straight with you all, over the last two issues I had leaned further towards the red path, the possibility of a final low in the 50-60k range, and a 'spring' in Wyckoff terms. I also ran the 2022 fractal forward and pointed to that final low just weeks out at the end of August. I did think that final low was very much imminent, but instead, Bitcoin broke to the upside and the count we have come away with is the bullish variation, although fundamentally still the same count.
There have been many calls for 30k or 40k Bitcoin, but never in this newsletter, and even though we didn’t get that last bite of the orange, it’s awesome to see such a strong recovery play out. Weekly candles like this are not uncommon for Bitcoin, but after months and months of trending down, everyone always forgets what they feel like.
In Elliott Wave there are always alternate ideas and counts that take us in different directions, and without additional confluence and context we could easily propose that this move is part of a larger sideways B-wave structure that eventually breaks down to new lows. Over the course of many newsletters we will always cover everything, however, because we try to marry the technical outlook with the macro outlook, the big picture looks far too bullish to propose those today.
In the shorter term, this 3 wave move off the low will need to develop into 5 waves, and as long as Bitcoin can trade above 82.8k in the next few weeks and months, we should be able to move on. That final 82.8k confirmation would be the 5th wave, setting a macro higher high, and putting the remaining, now lower probability bearish ideas to rest for good.
Macro Cycles
The macro outlook has been a huge part of my analysis throughout 2026, and there is much to be bullish about, so let’s recap where I think we are, although in this issue, because I want to get onto some more crypto specific charts, we’re just going to keep it simple and look at our main indicators.
Since February we’ve talked a lot about two factors, first the heating up of the business cycle as observed via the ISM PMI flipping positive at the end of January, just a few days prior to Bitcoin’s touch down at 60k, and second the liquidity squeeze that occurred in the months that followed as Oil prices rocketed higher in the recent energy crisis.
Back in February I was a strong supporter of a mid-cycle thesis, and was expecting Bitcoin to rise alongside the business cycle. Six months later, I think this is still a valid point of view, on the basis that we have seen an unexpected drain in liquidity over the same period that has pushed the outcome further out. Actually Bitcoin has held up pretty well, never really breaking that 60k low in any meaningful way and not reaching anything like the depths of retracement that we would see in a ‘normal’ Bitcoin bear market.
Overall, the thesis has always been based on the idea that Bitcoin follows the business cycle and the ebb and flow of liquidity, but at the same time I have evolved my viewpoint a little. I do see the 4 year cycle as a way to simplify the observable cyclical behaviour of the markets into tradable time cycles or perhaps sentiment cycles. I just don’t see that as the driving force behind the market, nor that they need to be rigid 4 year periods to the week or month as people often seem to think.
Cycle Alignment
Something I've been working on recently is my 'Cycle Dissonance' indicator, initially to show areas where Bitcoin's two main cycle narratives are in opposition, and explain why the last nearly 5 years have been so bad for crypto generally, with only selective outperformance in a few projects. The cycles began drifting apart at the 2021 highs, but have been fundamentally out of sync since 2023, and you can see these periods of misalignment in the white unshaded areas. Today's chart is updated to highlight periods where Bitcoin and crypto more broadly perform the best. These are areas of 'Constructive Interference' where waves come together to reinforce each other.
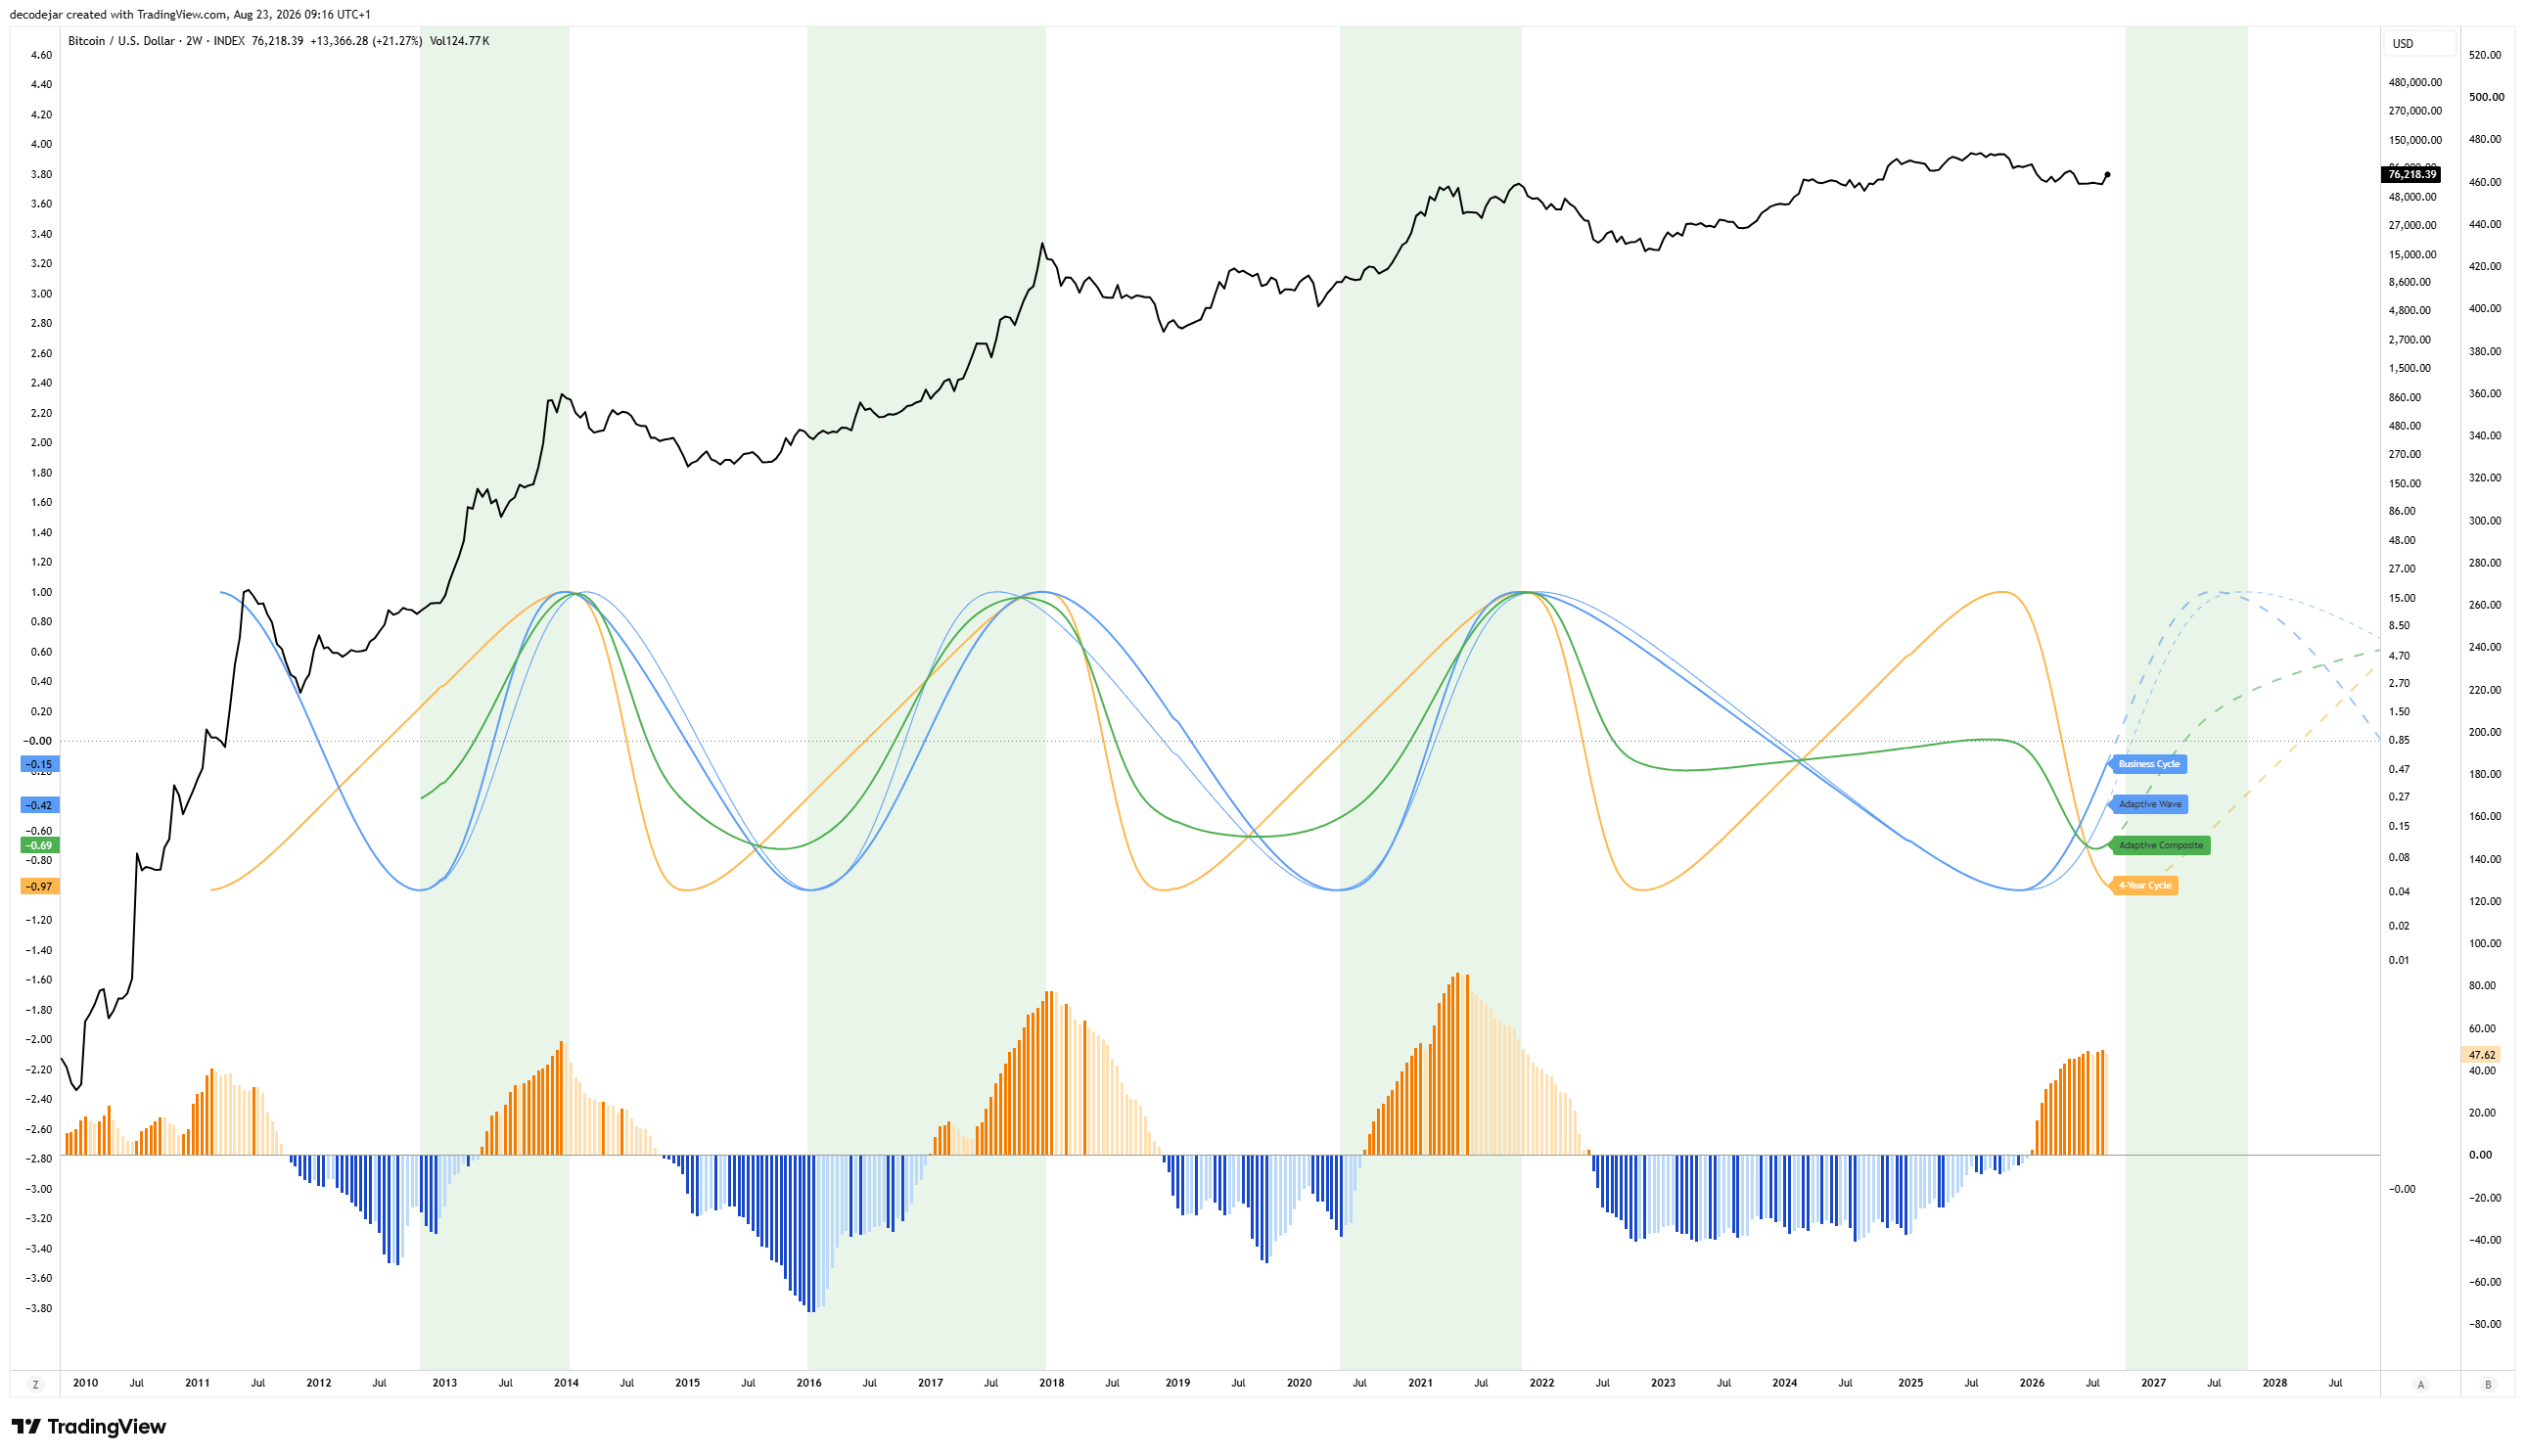
“All models are wrong but some are useful” is a phrase worth paying attention to, so take this with a pinch of salt, but if the green projected area of constructive interference is correct, we are in for a strong move across crypto over the next 12 months.
From there, no one knows, perhaps the business cycle holds up better than the data suggests, the projected peak pushes further out and we end up with a new full Bitcoin cycle, but right now the data suggests an extended macro liquidity cycle with a late-cycle blow-off as the most likely outcome. In 4 year cycle speak, that would be a left-translated cycle, where the top comes in before the half way mark.
Tracking the business cycle peak, the top is predicted to come in Q4 2027, and tracking a left-translated 4 year rhythm instead, perhaps Q2 2028. Bitcoin has historically always topped in one of these two quarters, giving us a 12-18 month window for this scenario to play out. Of course in a regular right-translated Bitcoin cycle, these targets can push out into 2029, which is closer to the long term count we looked at in May, and we will continue to look at that scenario in another issue.
Copper/Gold
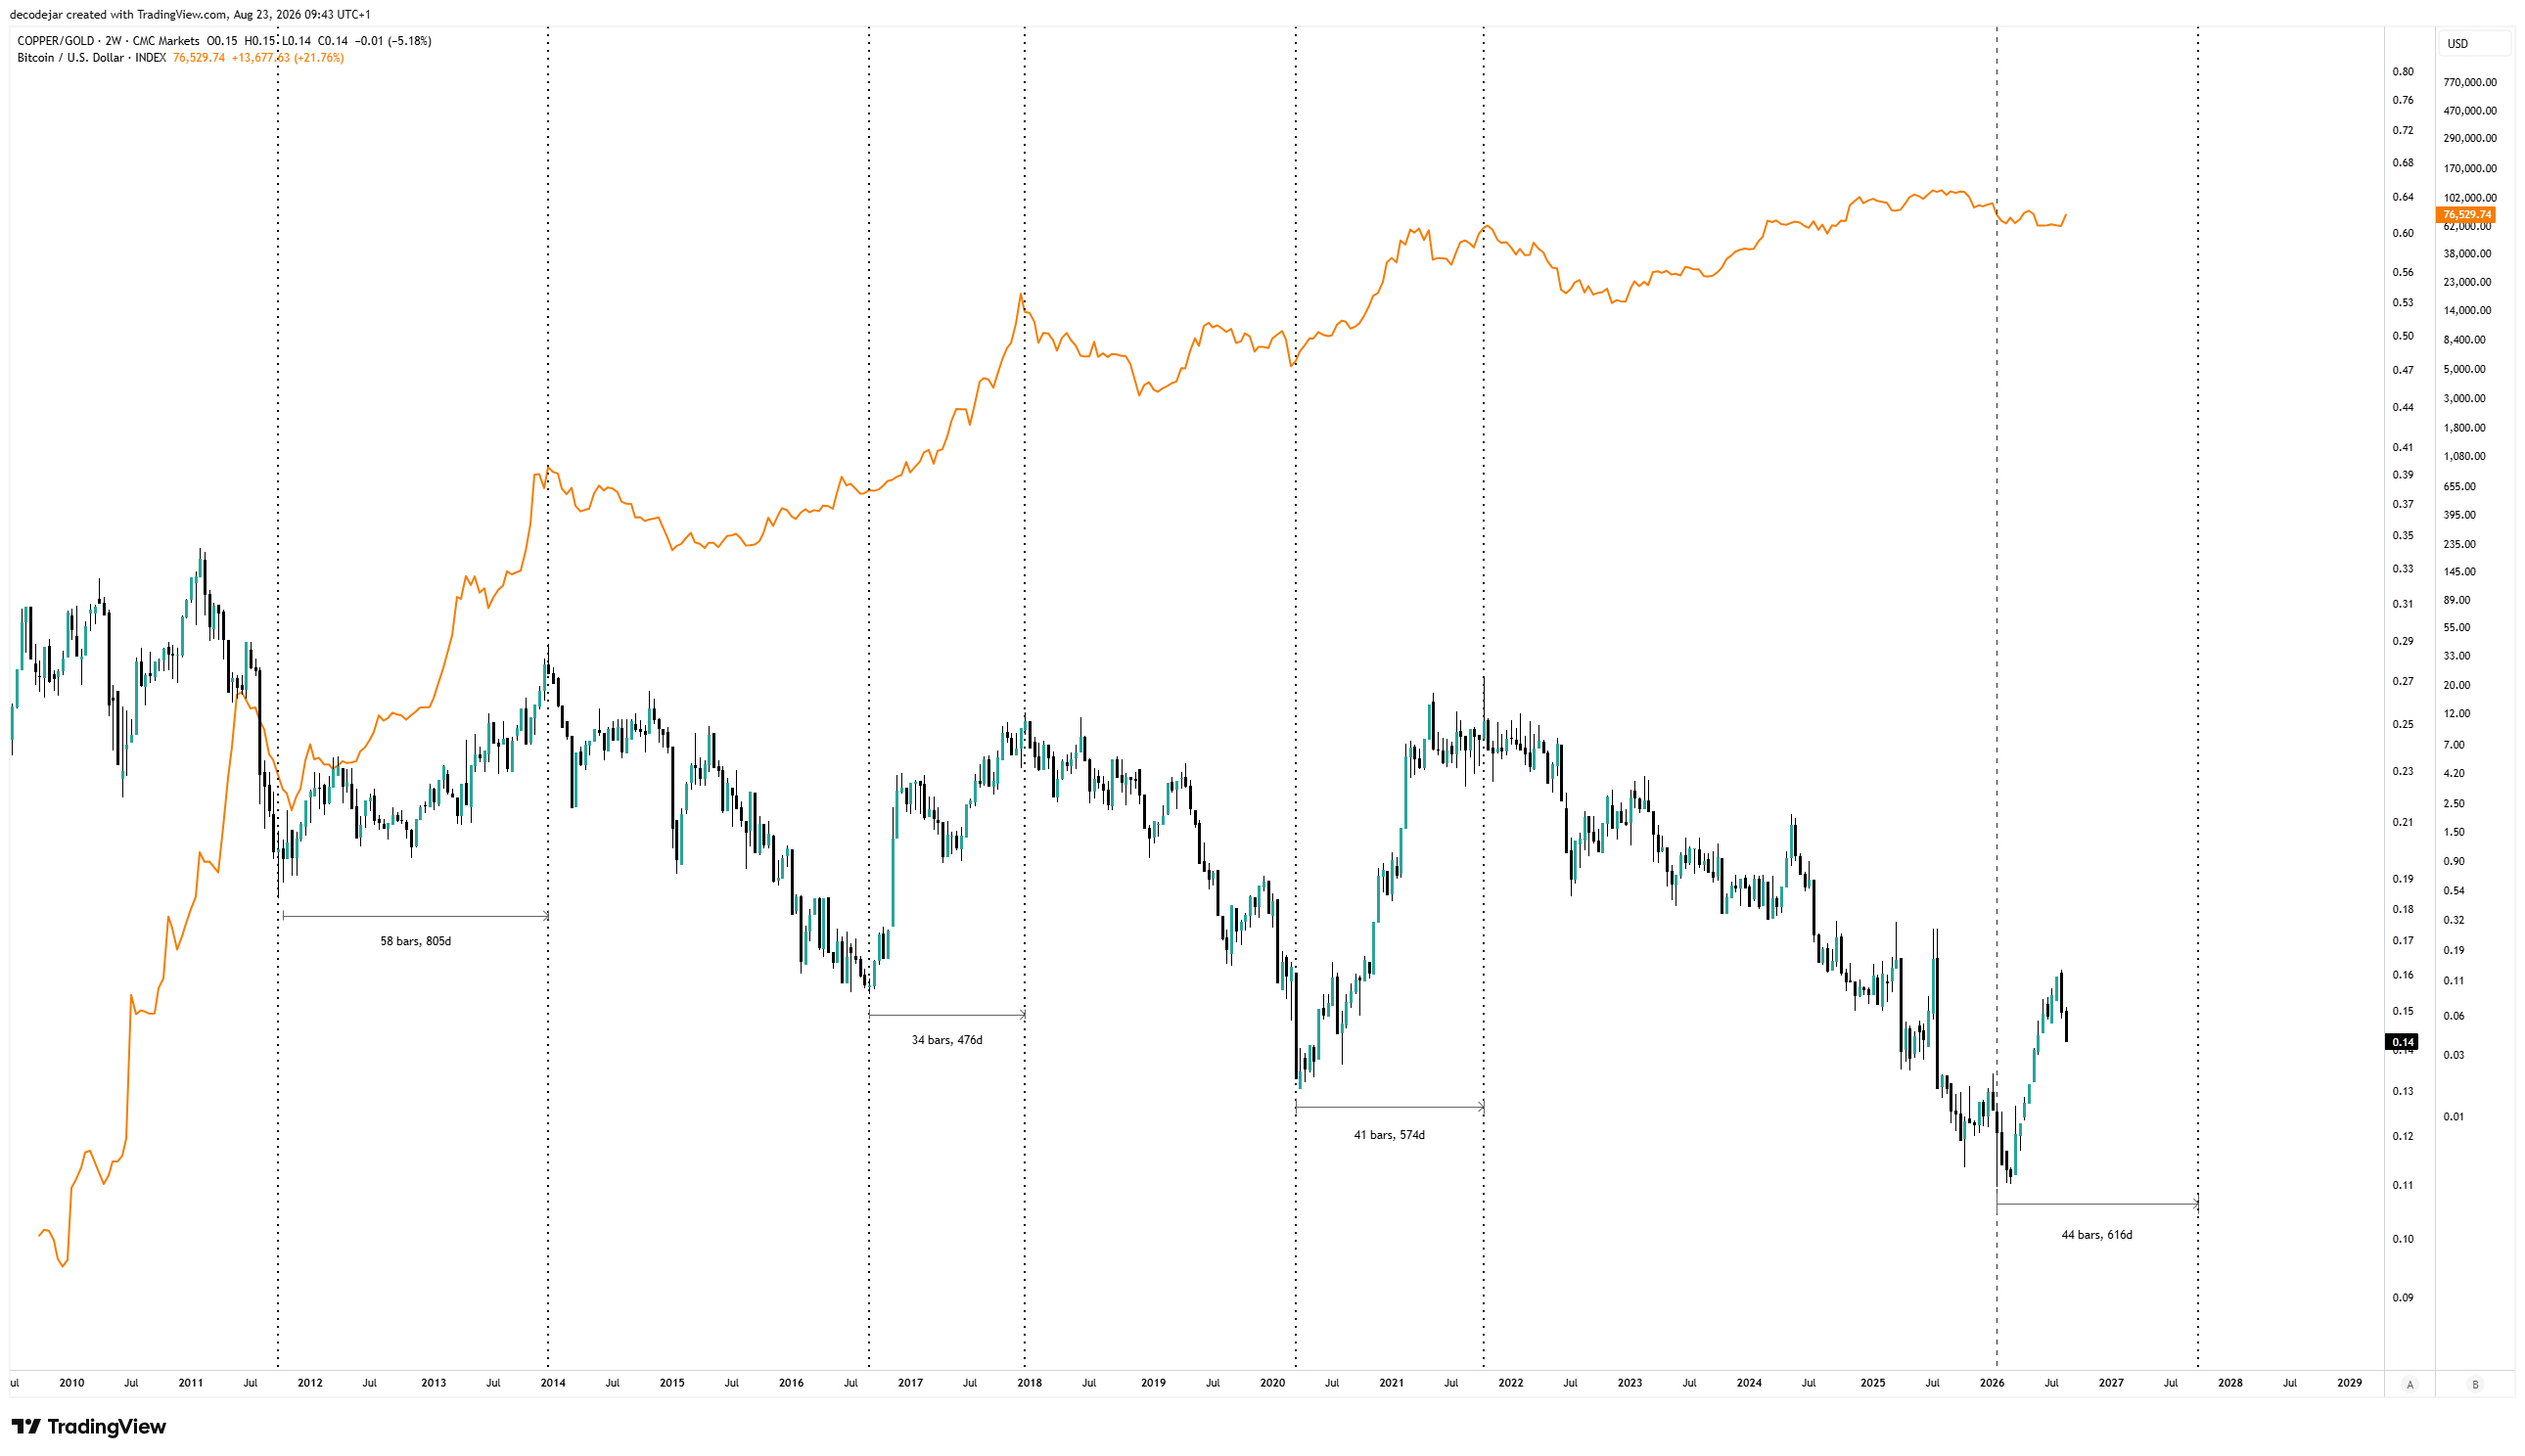
If we just look at the Copper/Gold ratio on its own, the average time taken to complete the last three bull cycles is a little over 600 days. Because the current cycle started early in 2026, the projection therefore lands towards the end of 2027 and aligns with our business cycle projection as well, despite the previous chart not being based on this data at all.
Liquidity
Looking at our Global Liquidity Index, we can see that since late June total liquidity has bounced directly off the zero line, keeping it in expansionary territory, and finally we can see that move reflected directly in the price of Bitcoin.
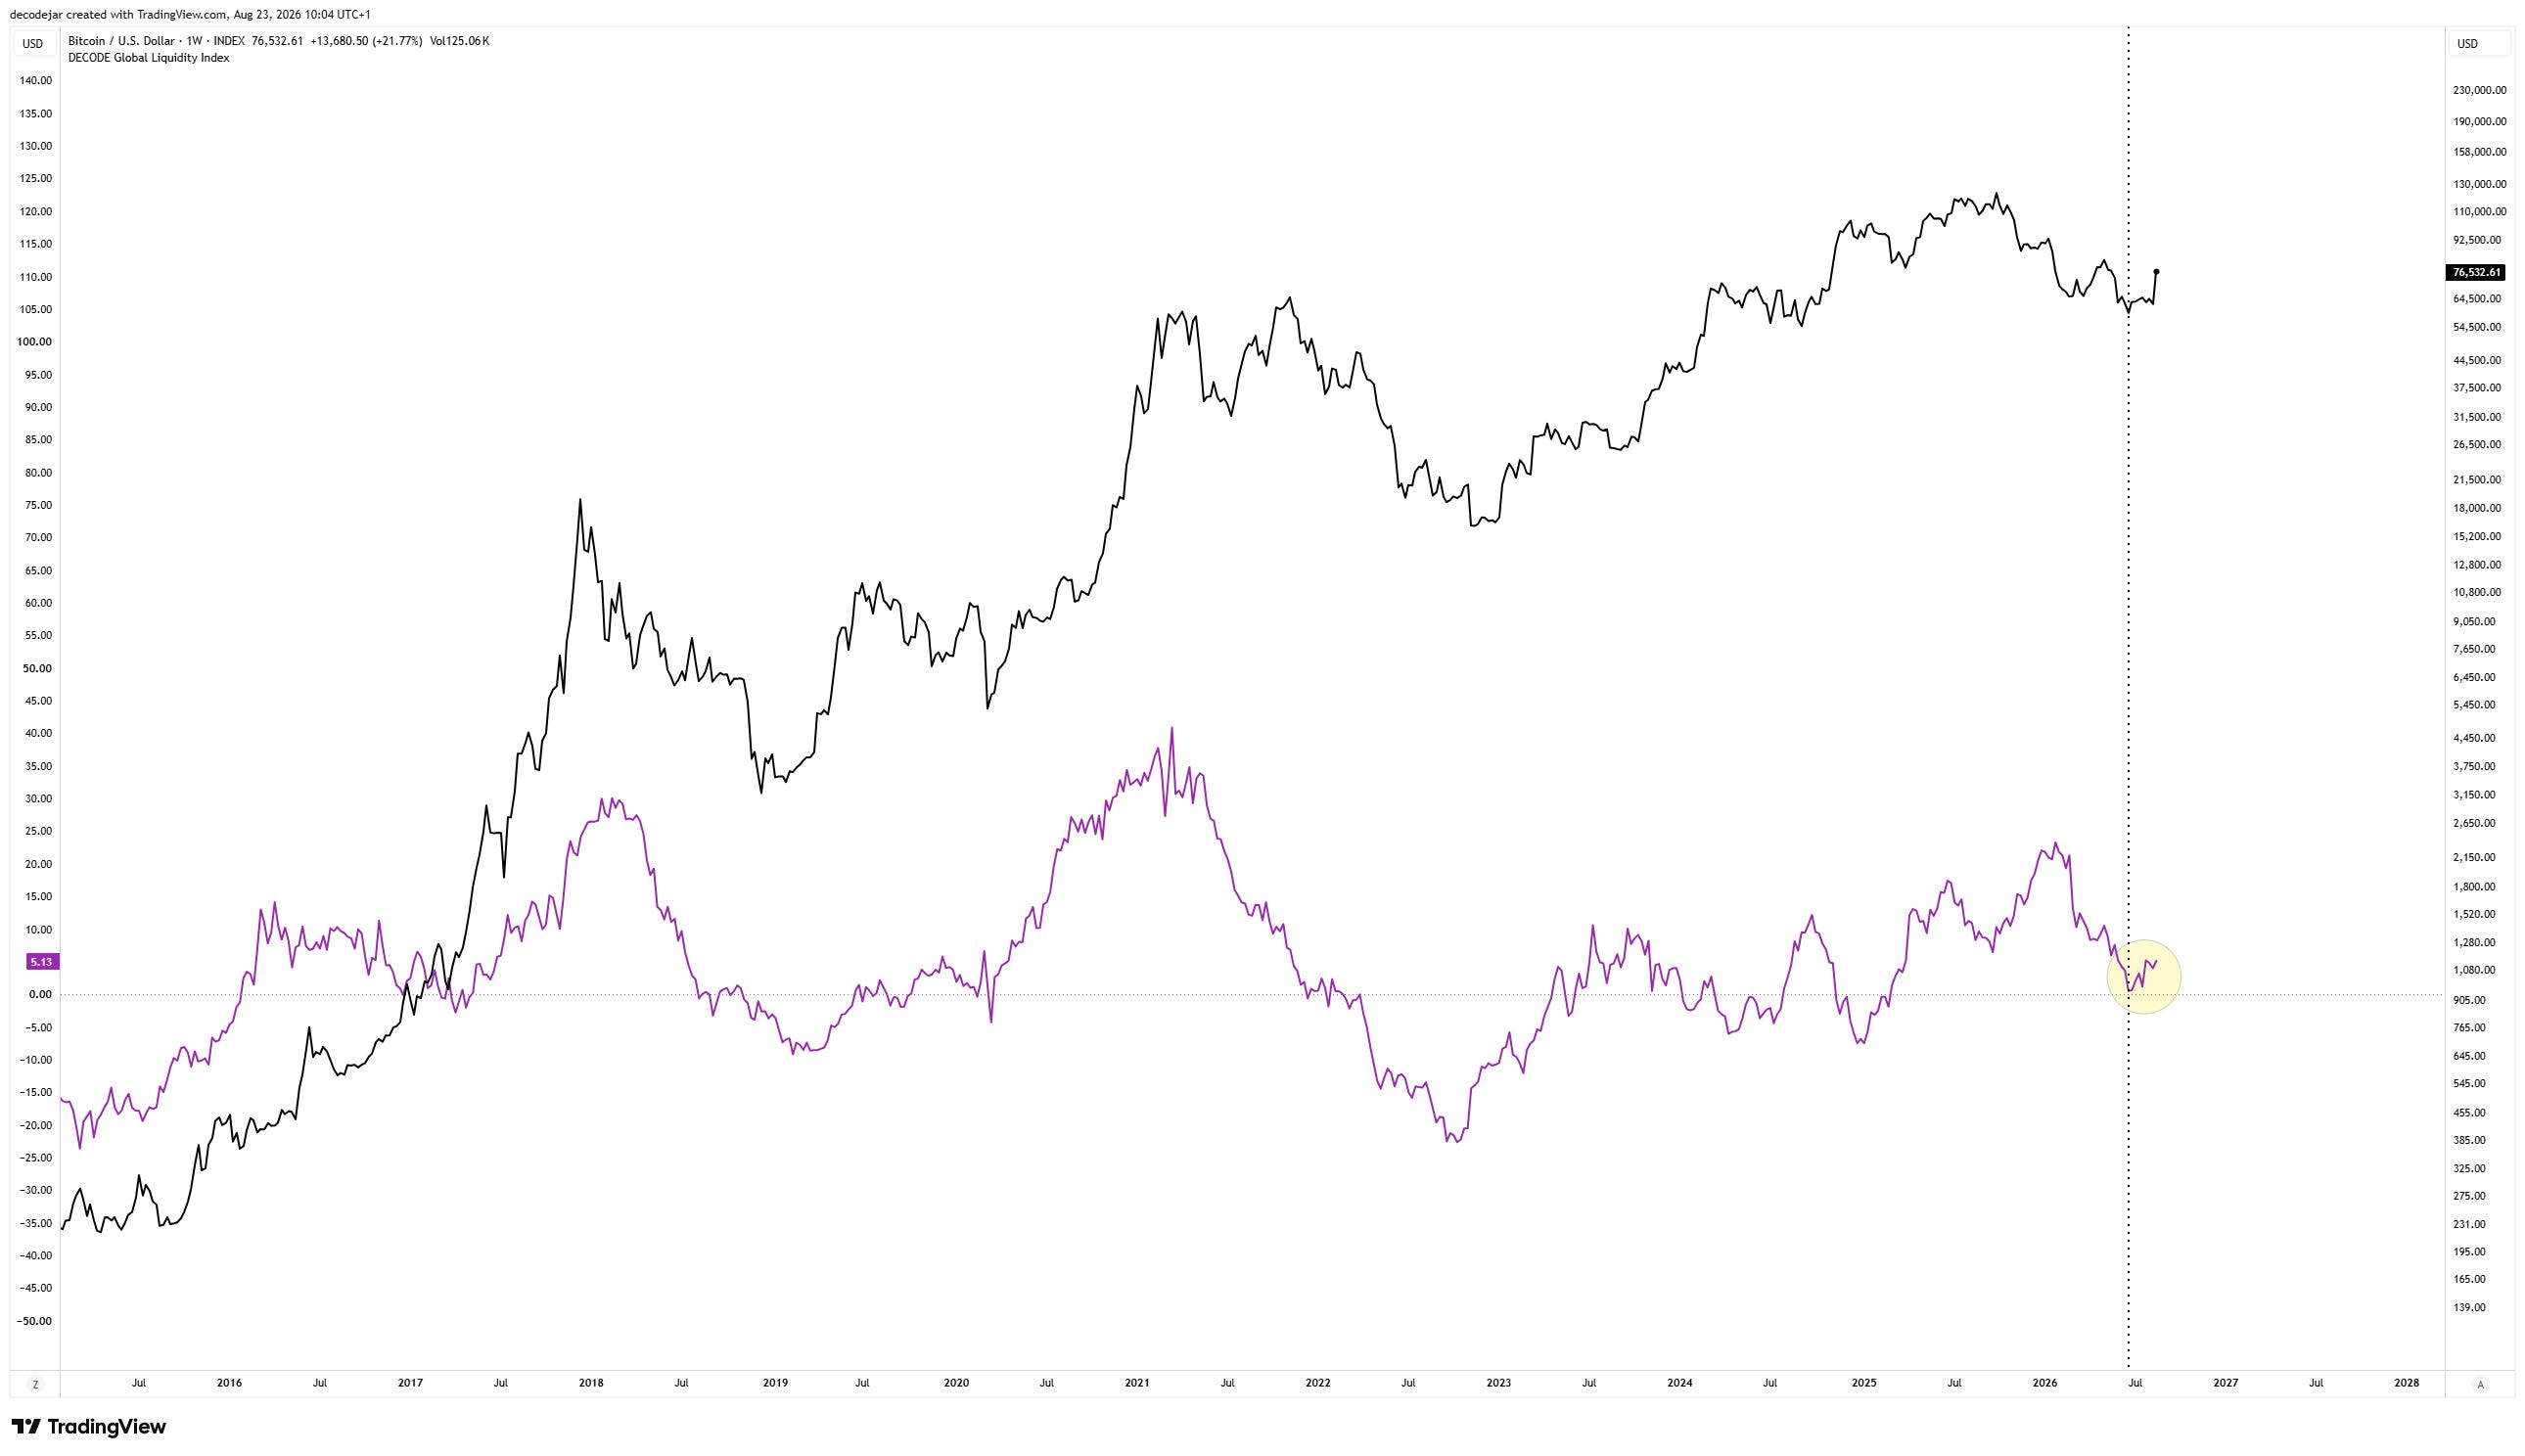
Liquidity indicators seem to get a lot of attention, but usually for the wrong reasons. The correlation here is not perfect, but I think this tracks quite well against the Bitcoin chart, and if the uptrend can continue we should see the broader crypto market follow. Compared to previous cycles, global liquidity has been far more restrictive overall, yet another reason for a lacklustre crypto cycle, but let's see if this recent increase can be sustained in a more significant leg higher.
Crypto
Moving on to the third section of this issue then, a look at the broader crypto market, the reaction to the Bitcoin pump so far and what I think that might look like going forwards. Since February we have repeatedly noted that a handful of strong projects had bottomed at that initial 60k low on Bitcoin, so for Bitcoin itself to bottom another 5 months later is very similar to how things played out in 2022, when Ethereum bottomed in June and Bitcoin 5 months later in November.
For this reason we have been looking at the last 6 months as a period of max opportunity, despite continuing to look for a convincing final low in the meantime, and I think that window of opportunity is now starting to close. Of course, there are always pull backs, so it’s not done yet, but we know from previous cycle lows that once Bitcoin gets moving it tends to move quickly and doesn’t look back.
Bitcoin aside, the real story today is altcoins. If the thesis holds up, the next 12-18 months could be a massive rotation event from large cap to small cap as capital travels further down the risk curve and into the most beaten down asset class there is.
Bitcoin Dominance
BTC.D or Bitcoin Dominance is the most obvious place to look for a cycle that hasn't completed, that is if you believe that there must be a rotation into altcoins to complete a cycle.
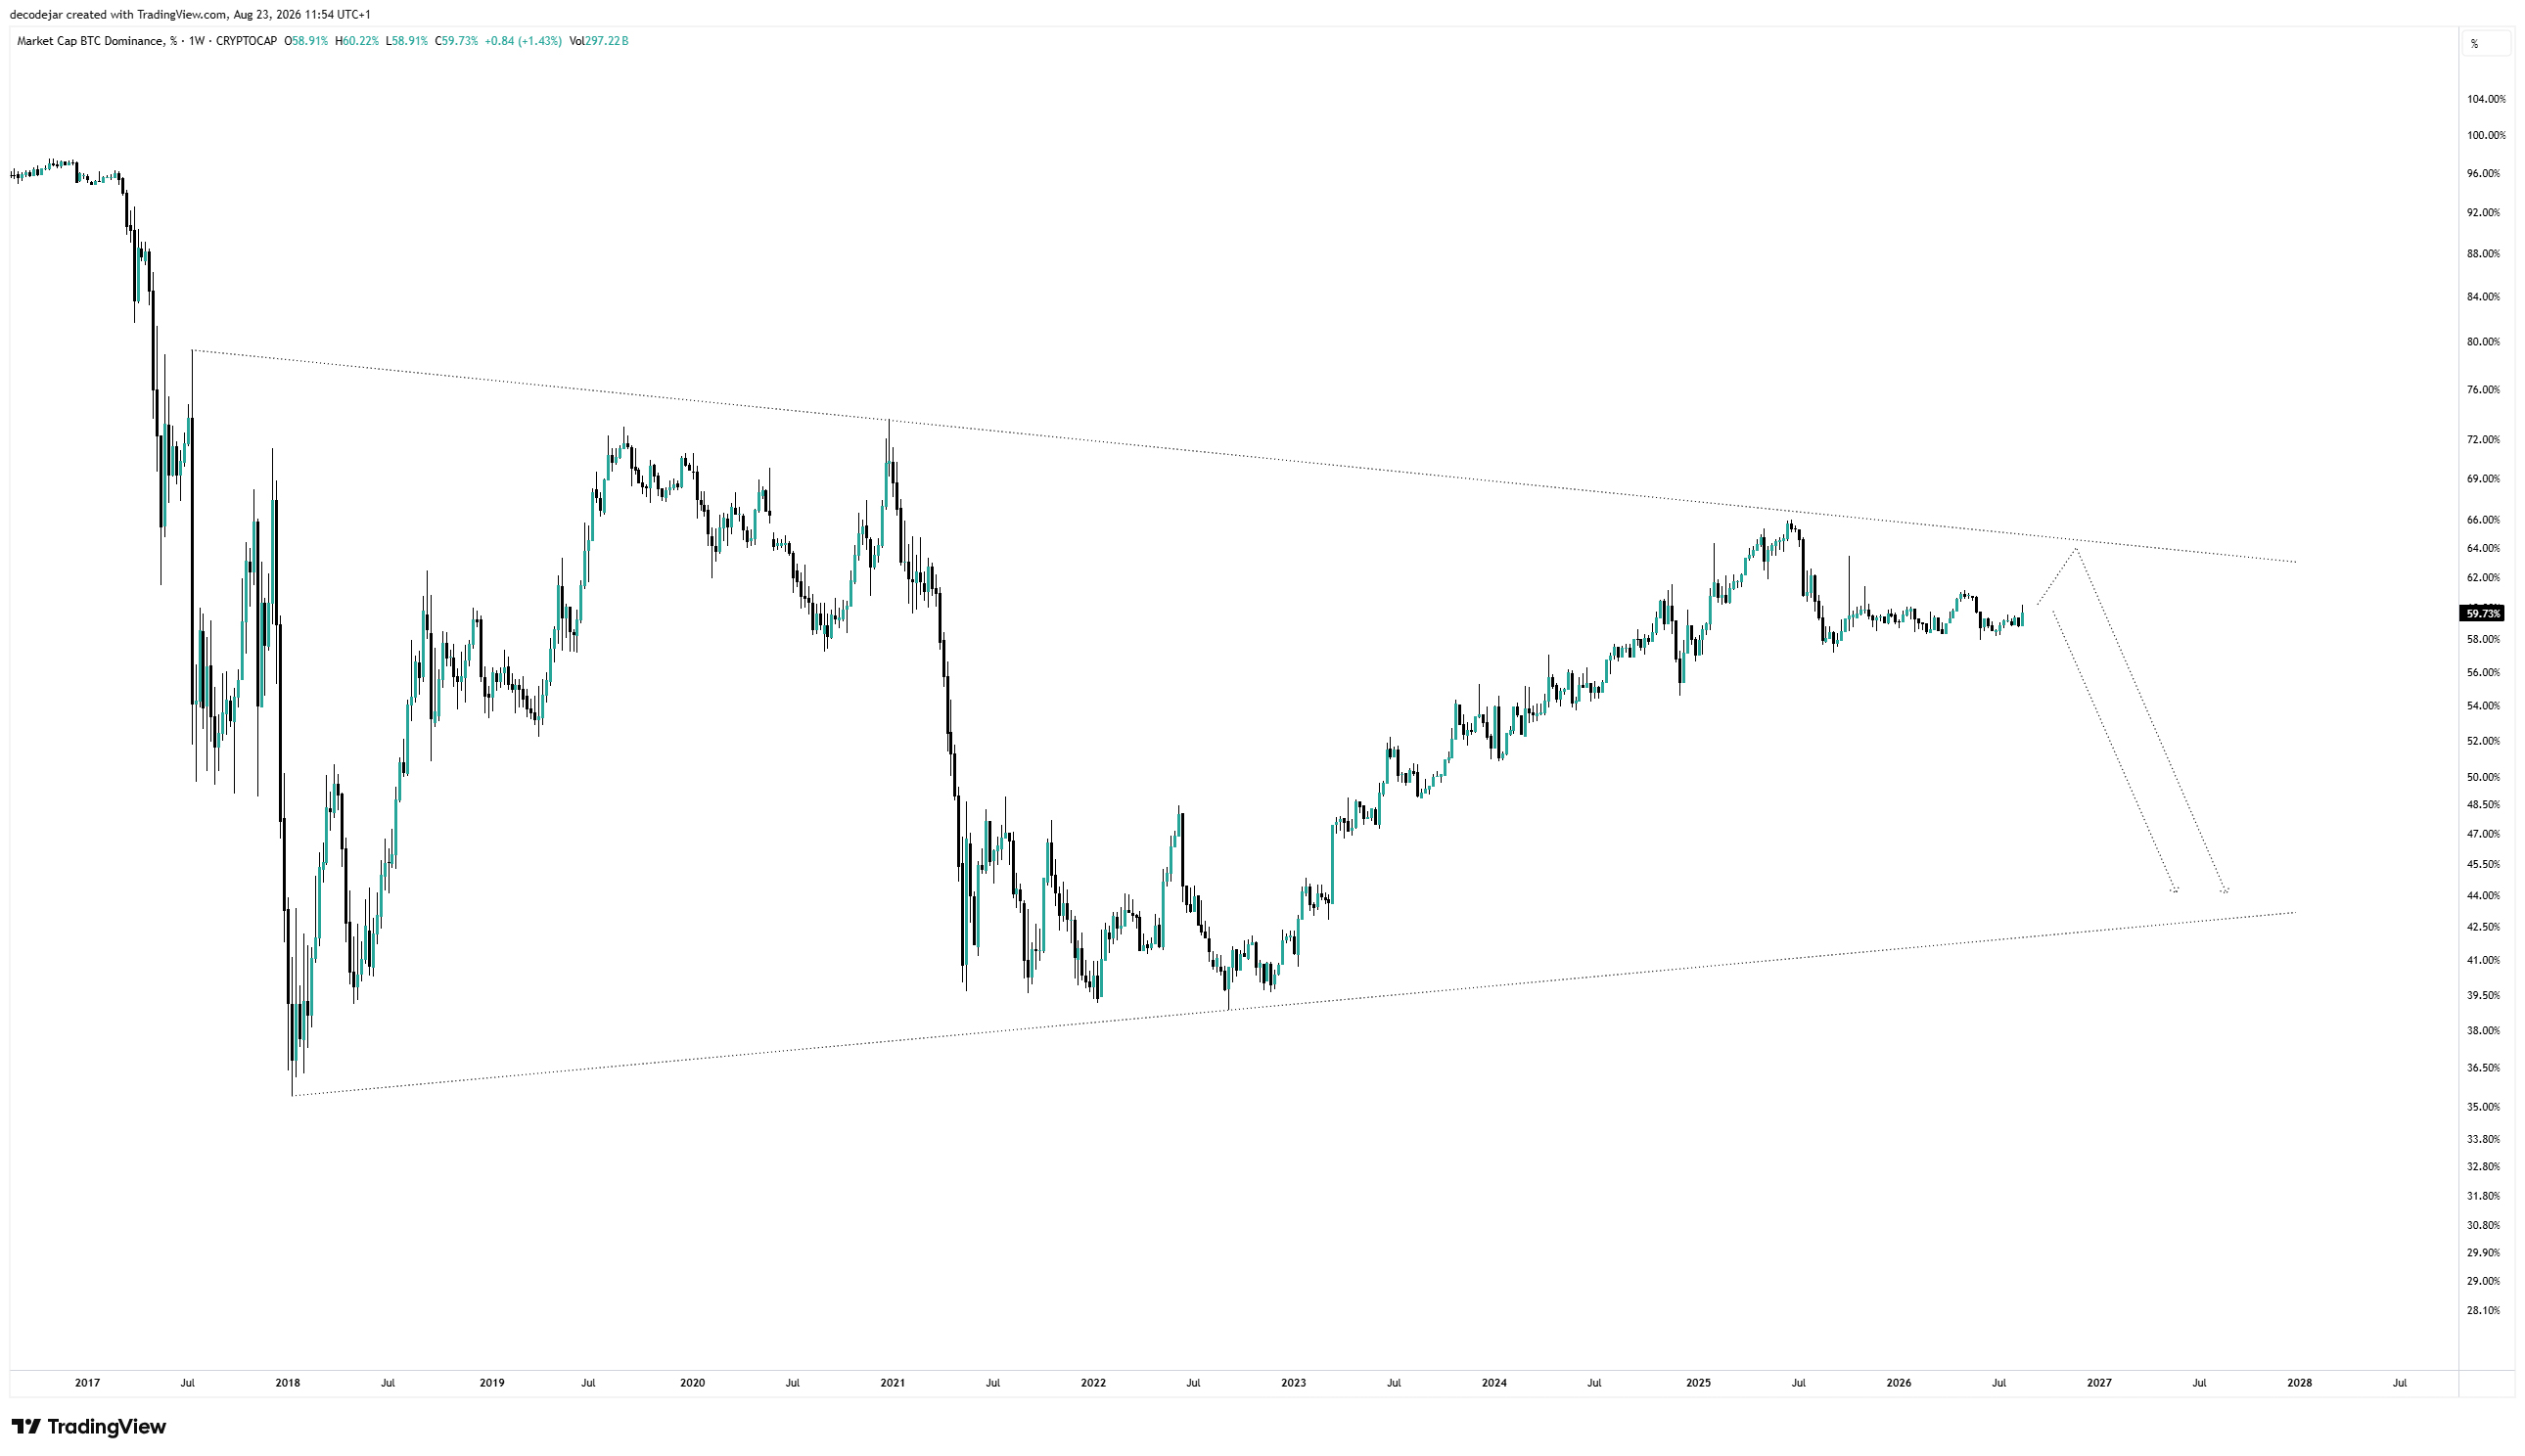
I’ve heard things like “the market topped on apathy”, but I’ve come to my own conclusions over time that crypto’s underperformance is more closely related to the business cycle than anything else. To this point, there is a glaring omission on the chart above, which is that Bitcoin Dominance should trend back to the lower trendline as the new business cycle lifts crypto out of its extended macro bear market.
Whether dominance first needs to rise as Bitcoin rallies from the lows, or if altcoins outperform from the get go, remains to be seen. There are not many data points to look at here, but there is no doubt this chart is incredibly bullish for crypto once it starts to break down.
Ethereum
In previous issues I had not included my macro count for Ethereum. I wanted to see if the April 2025 lows would hold through June 2026 as it would have dramatically changed the count. ETH held the lows, has since rallied strongly and I believe that $1,384 level is now safe.
Despite this, I still decided it was worth recounting the price action since the 2021 highs and have come to the conclusion that this is just an even larger wave 4 consolidation, and actually, because it made a marginal higher high in 2025, a massive bullish running flat pattern.
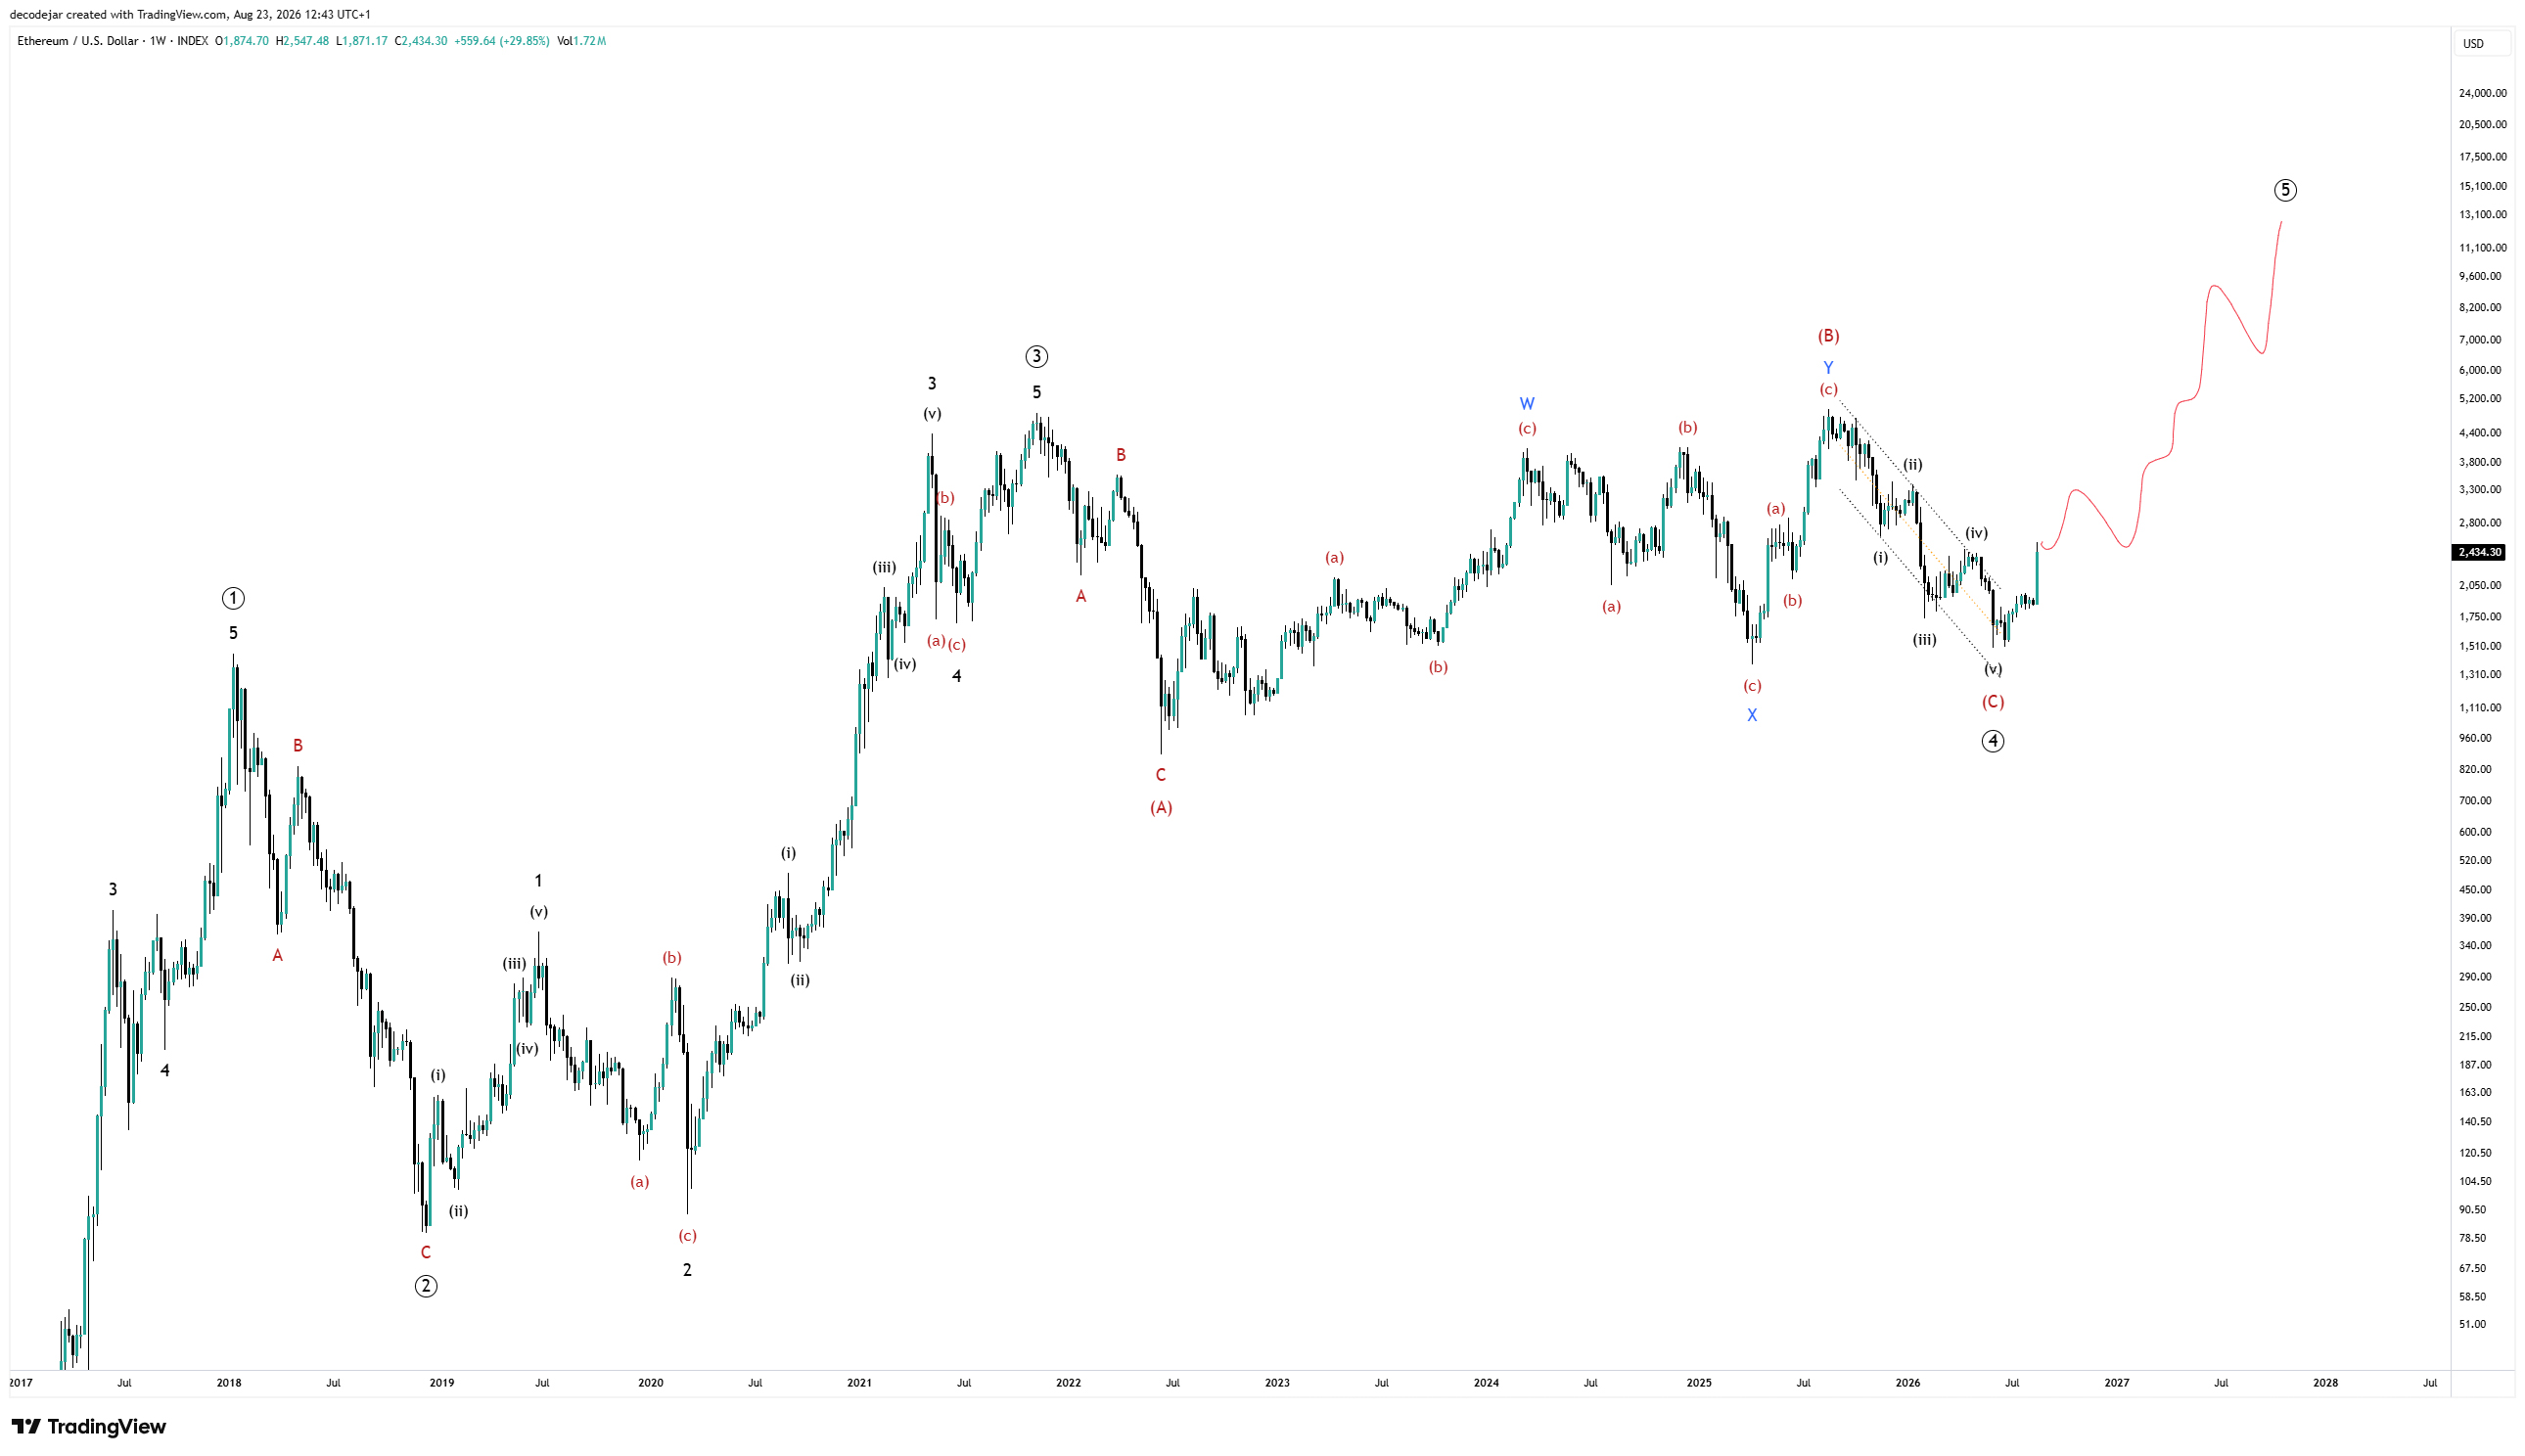
Generally speaking I don’t like to throw terms like ‘blow-off-top’ around. I prefer to stay on the more cautious end, despite being able to find data to back that view up. With Bitcoin, it has a very strong prior cycle structure that has to break, but with Ethereum there is no such issue. Its wave structure is strongly correlated to macro cycles and with such a huge base I can’t help but be extremely bullish on this asset.
A typical 1.618 extension, inverse the depth of wave 4, for wave 5 should bring ETH to around 10k, and where this count can be left open for discussion is whether that will be the completion of wave 5, or just wave 1 of a larger wave 5 over time. In the near term it is also worth mentioning that Ethereum has already taken out its April highs, equivalent to the 82.8k level that Bitcoin has yet to reclaim.
Sui
I've taken the time to go back and recount this as well, and to be completely honest SUI presents a somewhat awkward chart. I have decided to label this as a larger ABC structure, as there is no clear 5 wave impulse on the chart today. SUI clearly topped out after a 3 wave macro move.
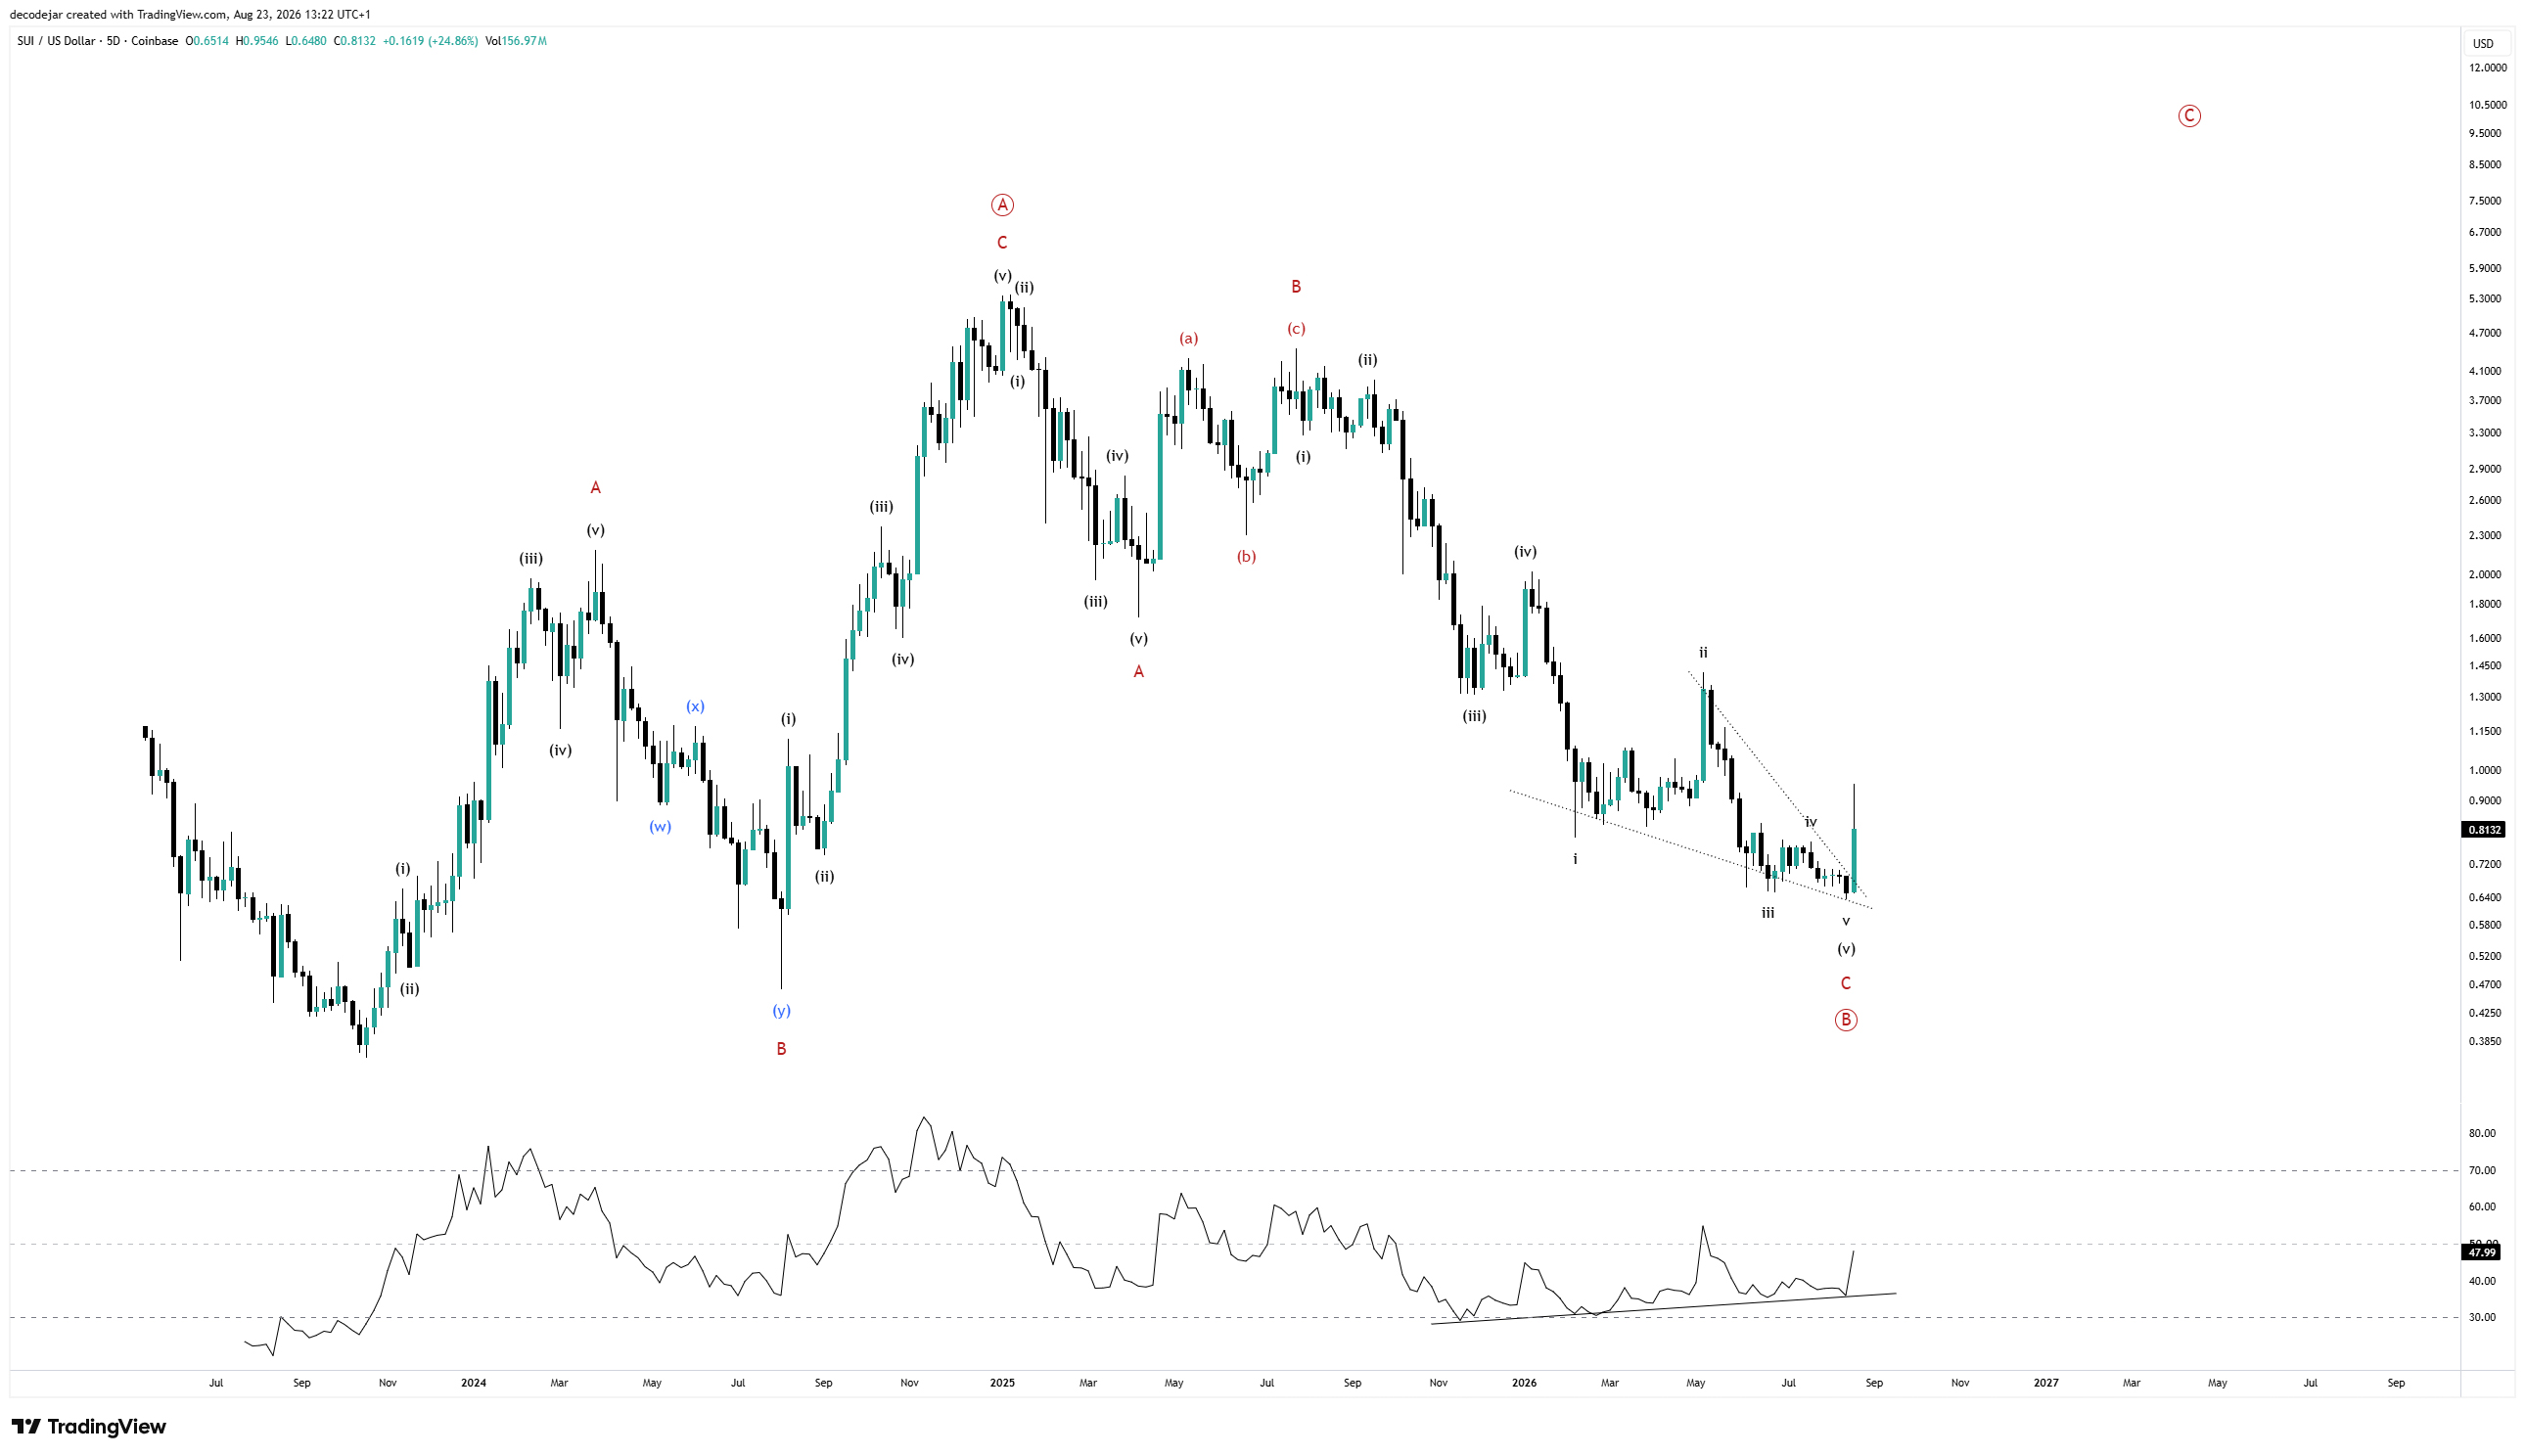
This does make it a little bit difficult to be very long term bullish on SUI, at least as the chart stands today, but if wave C were to reach a 1:1 ratio with the length of wave A, we have a target up around $9.
The most compelling feature of this chart is the 9 months of bullish divergence that has been forming as Sui has made lower lows, in what I think can be labelled as a wave 5 ending diagonal. Relative to other coins, Sui is not showing the most strength, with a wick off the current weekly candle showing that sellers are still very much in control. We will wait and see if this really is the low, or if we are still in wave 4 of 5.
I like to keep tracking the weakness in SUI because it helps to balance my overall view of the crypto market, as we should see strength here when things really turn.
Bittensor
Next is the chart of TAO, a project that I think has the potential to be a top 10 or even top 5 crypto at the next cycle peak, and the chart continues to take the form of an enormous macro bull flag and is currently still well above its February lows.
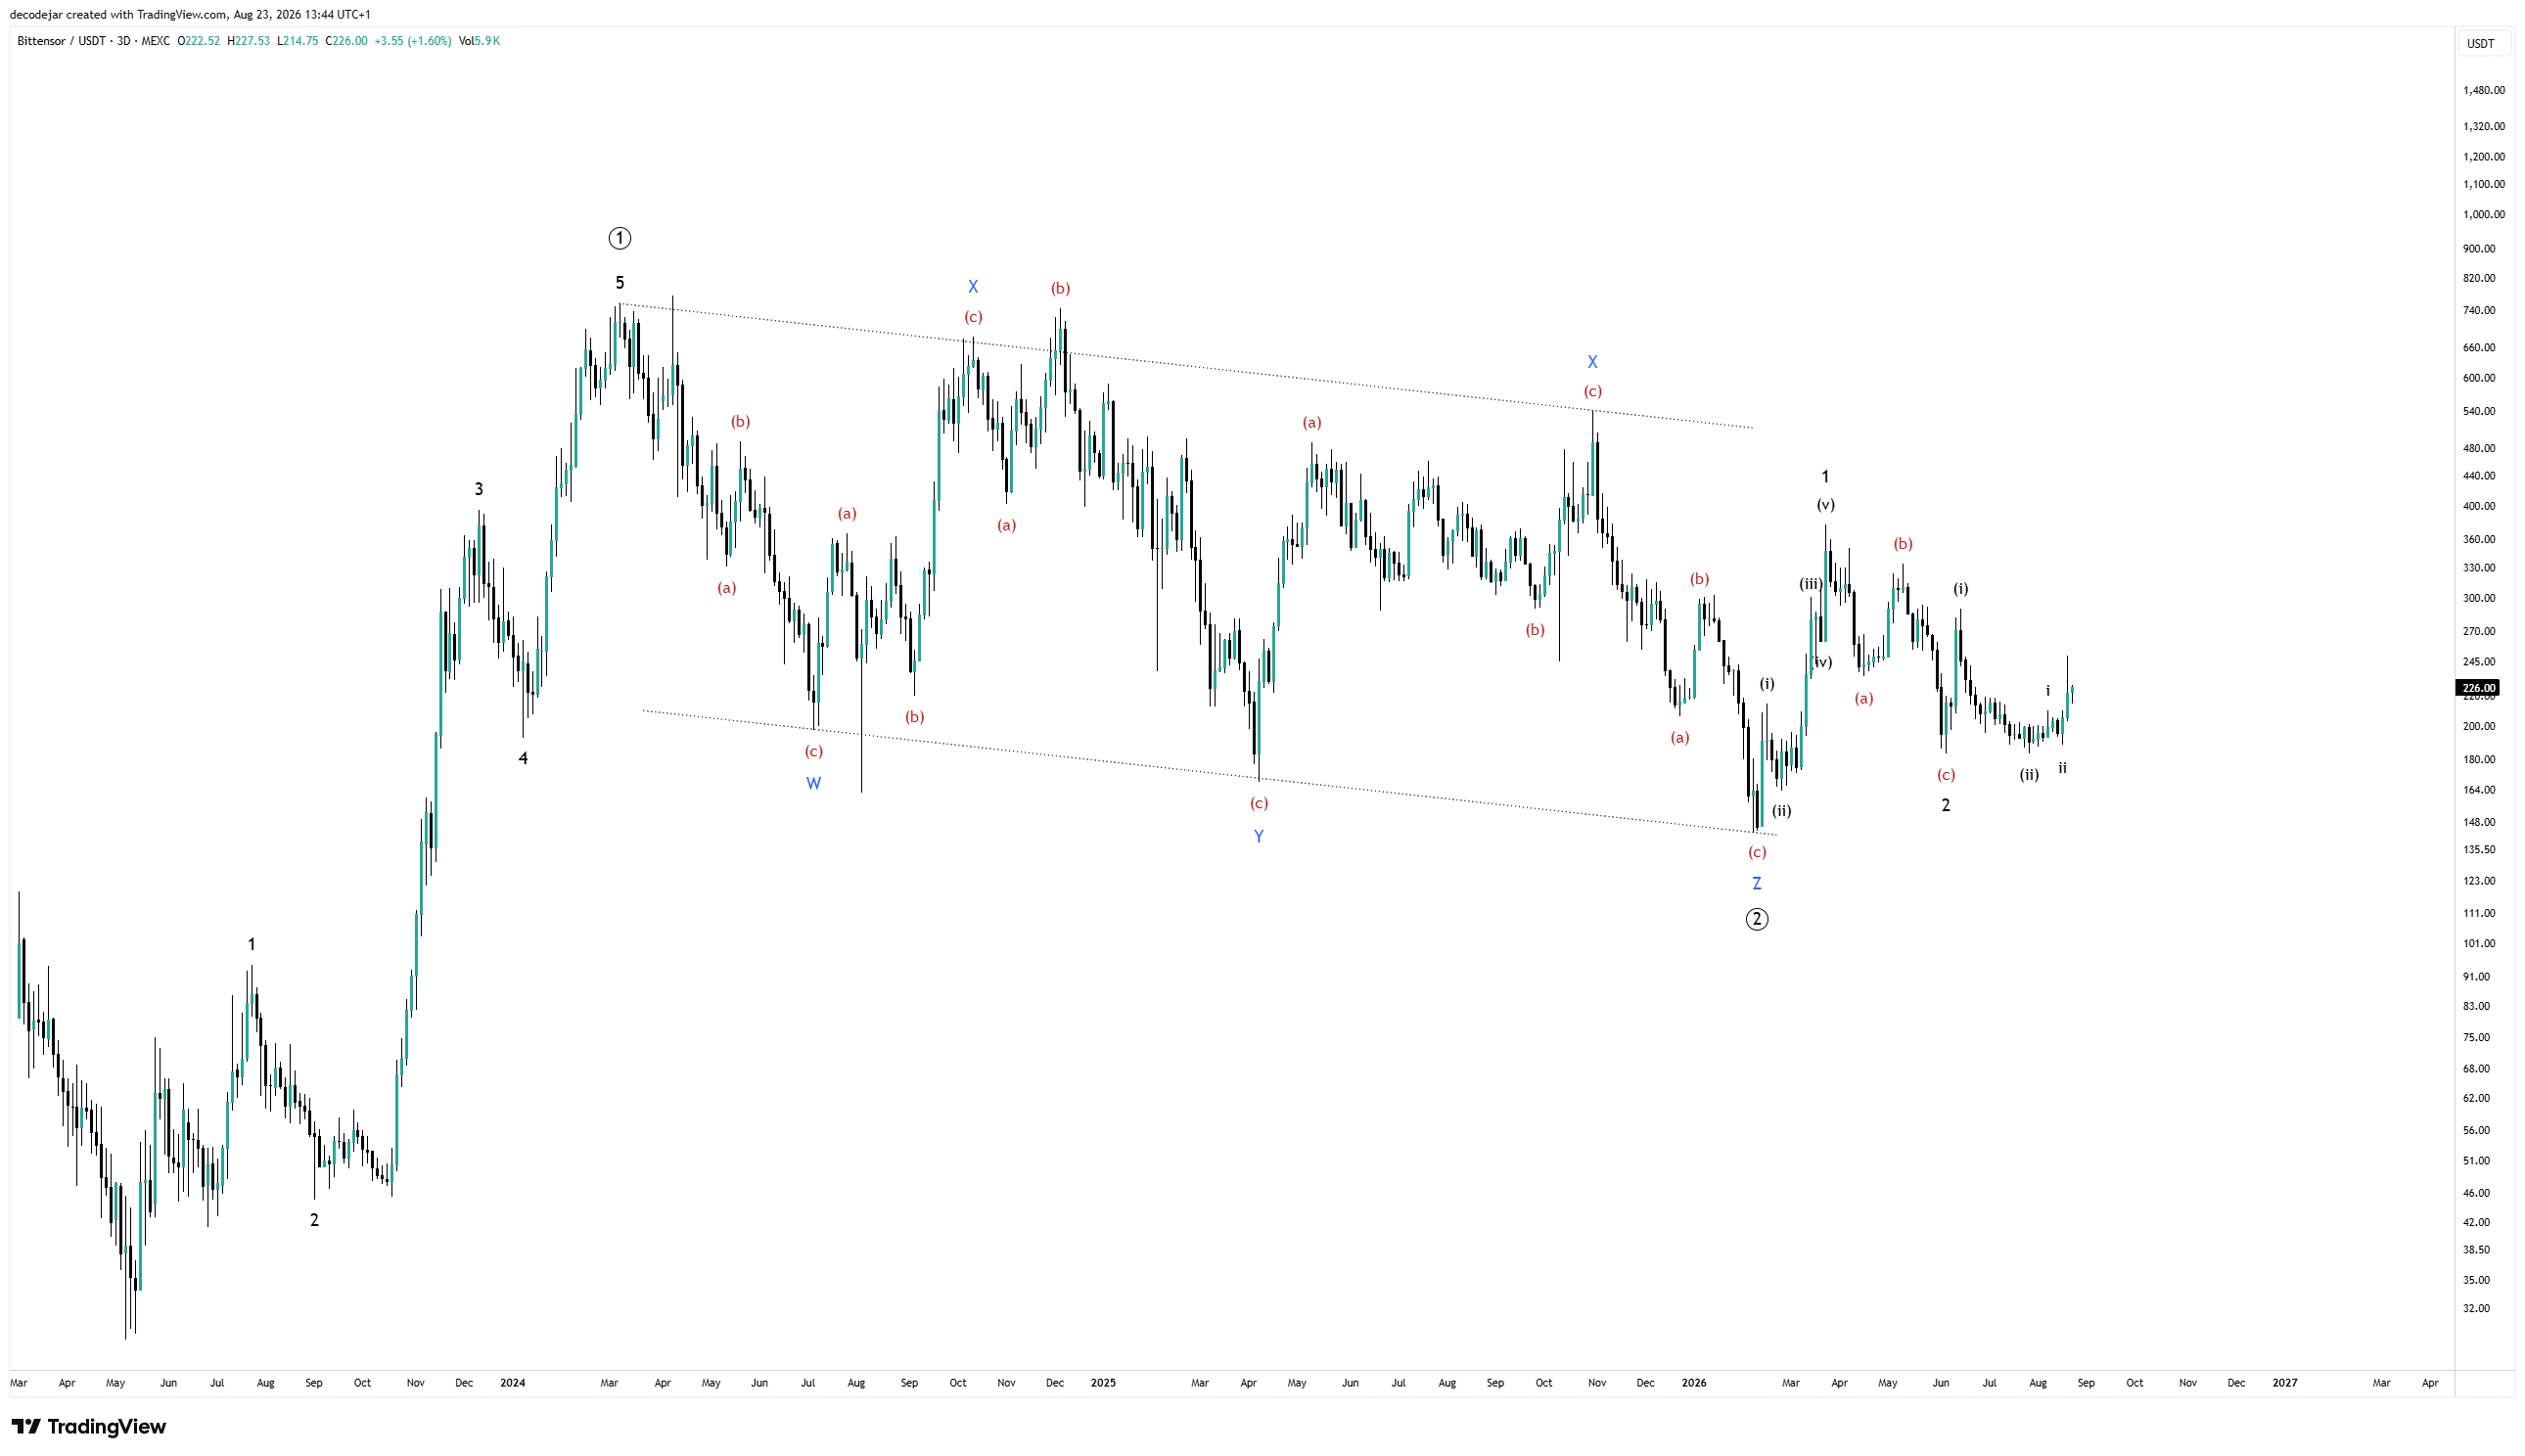
In recent newsletters I have been increasingly concerned that the stock market is reaching unsustainable levels, and I’ll remind you now that if you look at SPX on a 2 month chart, the RSI at 83.51 has only been more overbought twice in the last 40 years, in 2015 and the late 90s Dot Com bubble.
I mention that here alongside TAO because the majority of that capital is flowing into large cap AI stocks, but at some point that has to rotate and flow down the risk curve. I don’t see any reason why decentralised AI tokens like TAO would not be the primary beneficiary of that rotation.
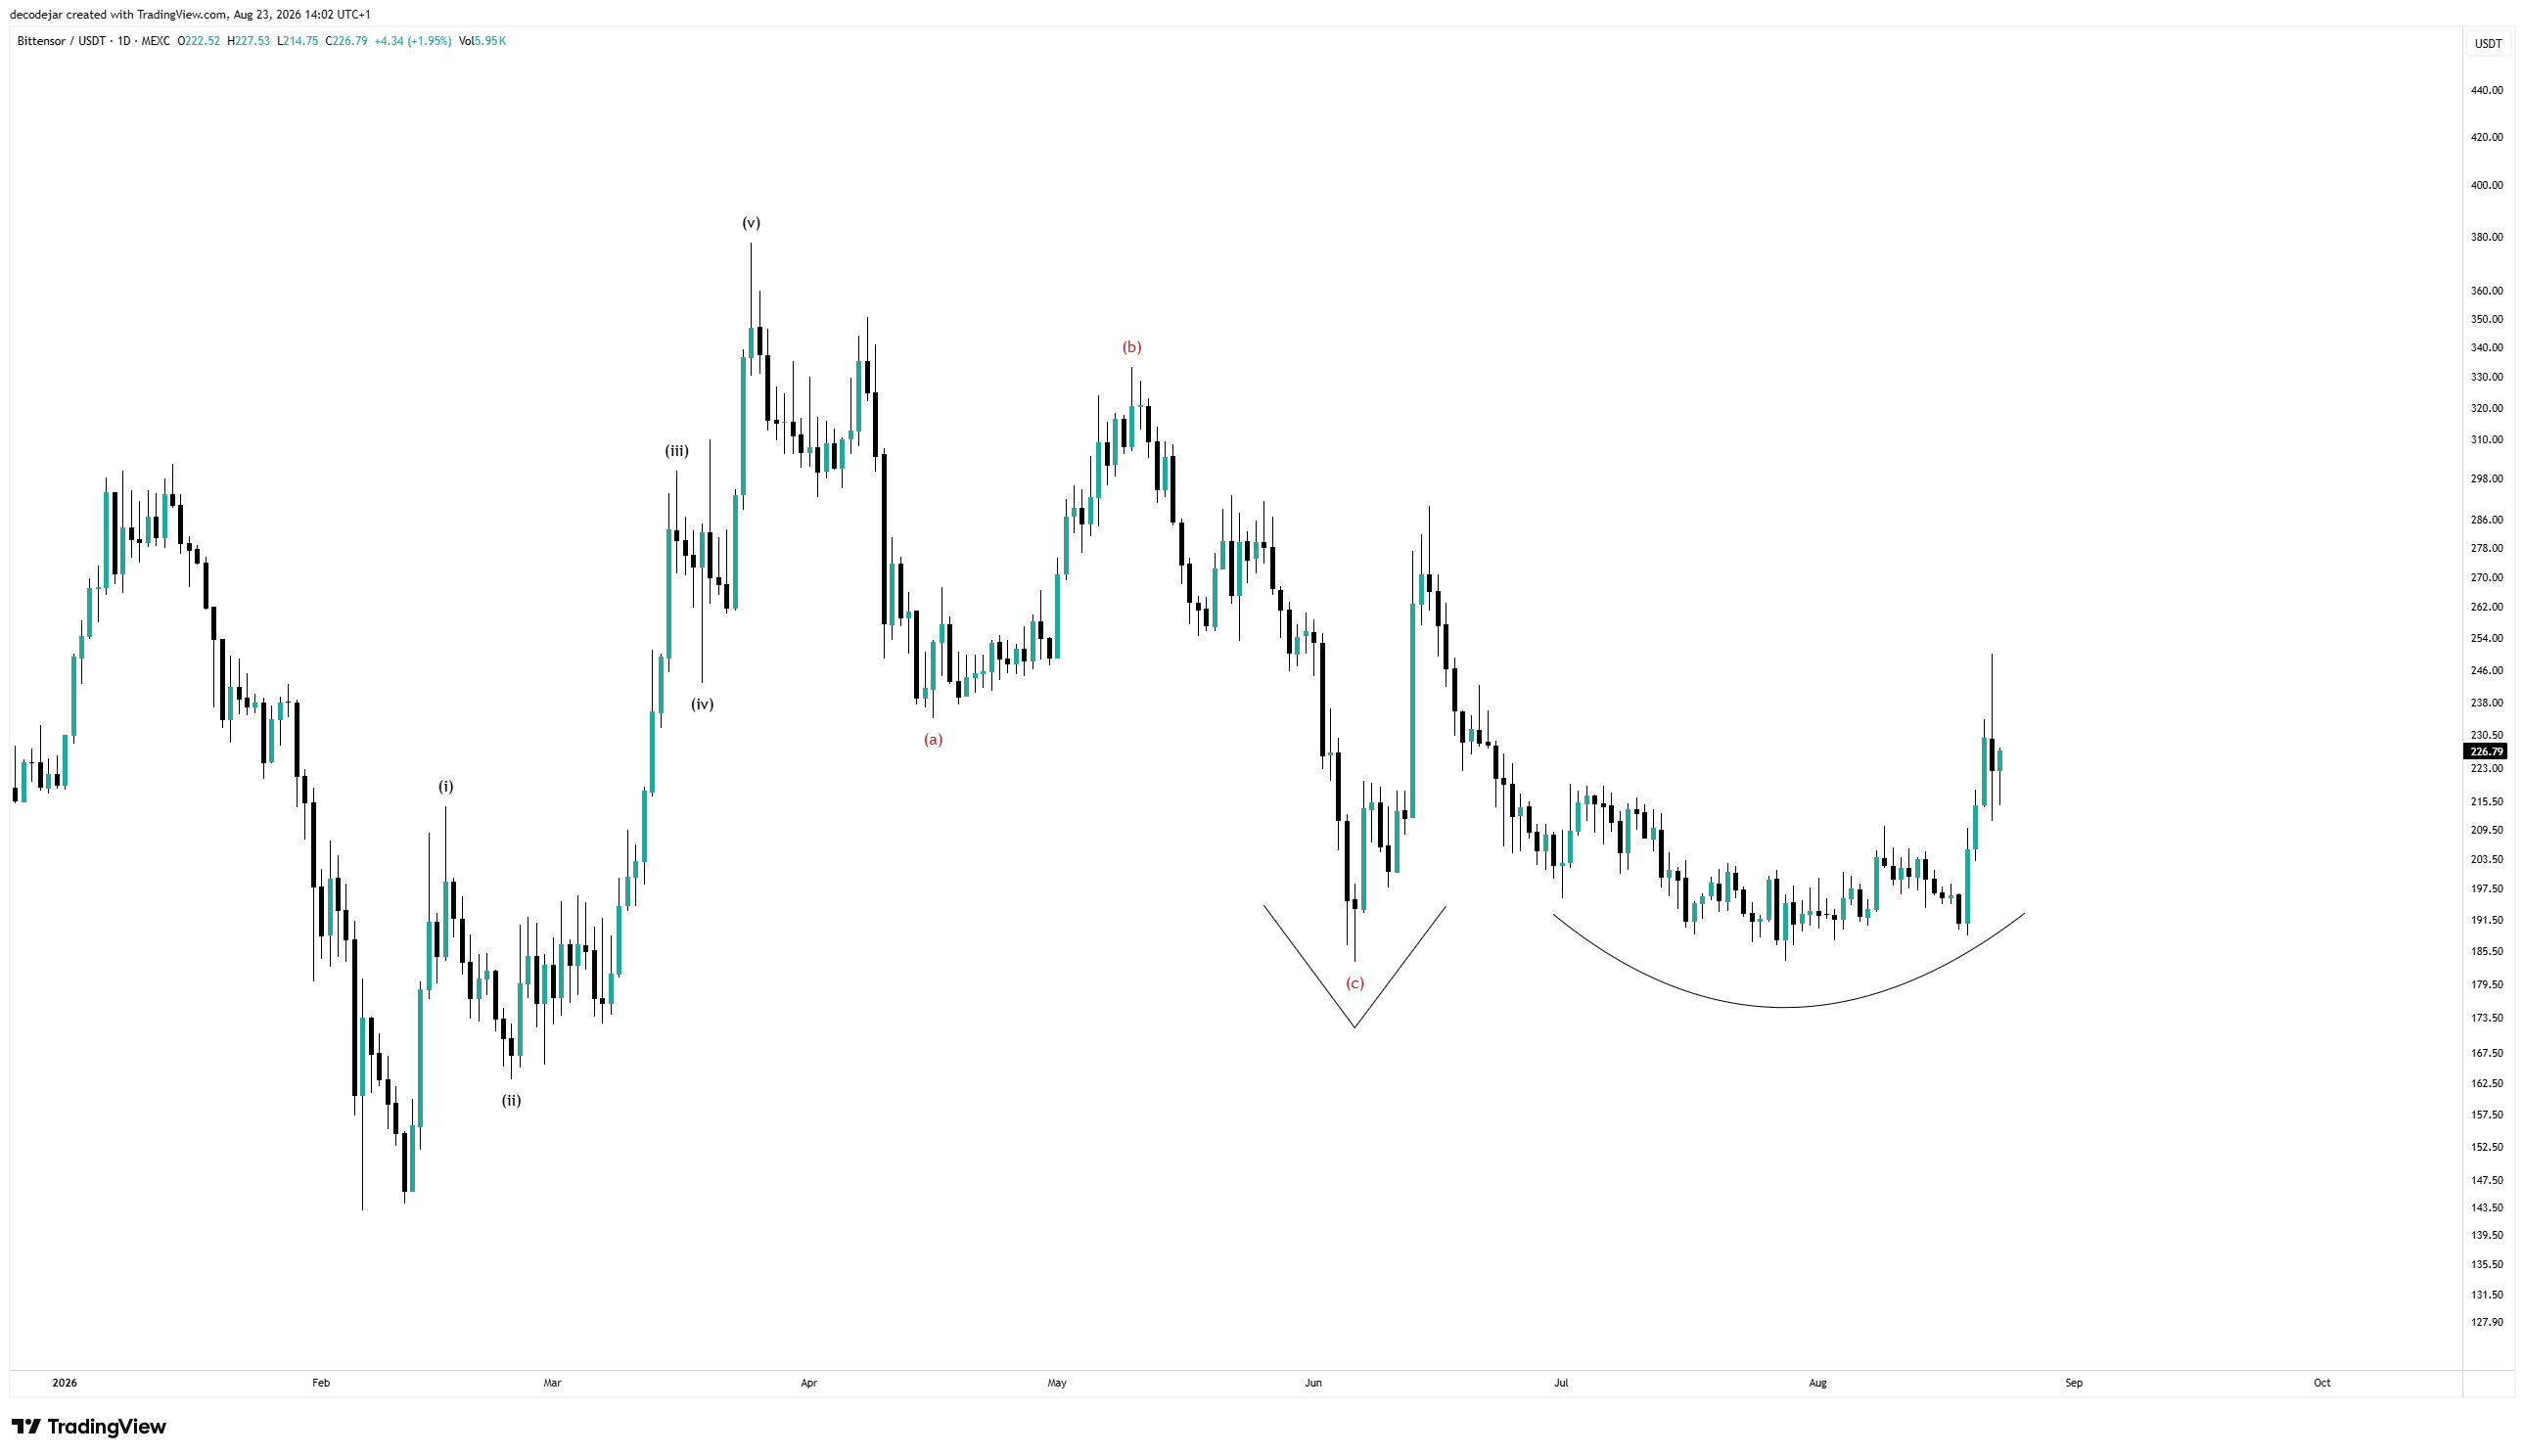
On a lower timeframe, Bittensor exhibits a clean 5 wave impulse off the February lows, followed by a clear 3 wave correction into a classic Adam and Eve bottom formation. What's not to like about this chart?
Velo
A quick look at VELO before I wrap up, and unfortunately it's just more of the same sideways chop, with declining highs. In typical technical analysis this would indicate a final low is in store, much like the declining highs in the 2018 Bitcoin bear market, however we do have the same 9 month bullish divergence that we see on SUI.
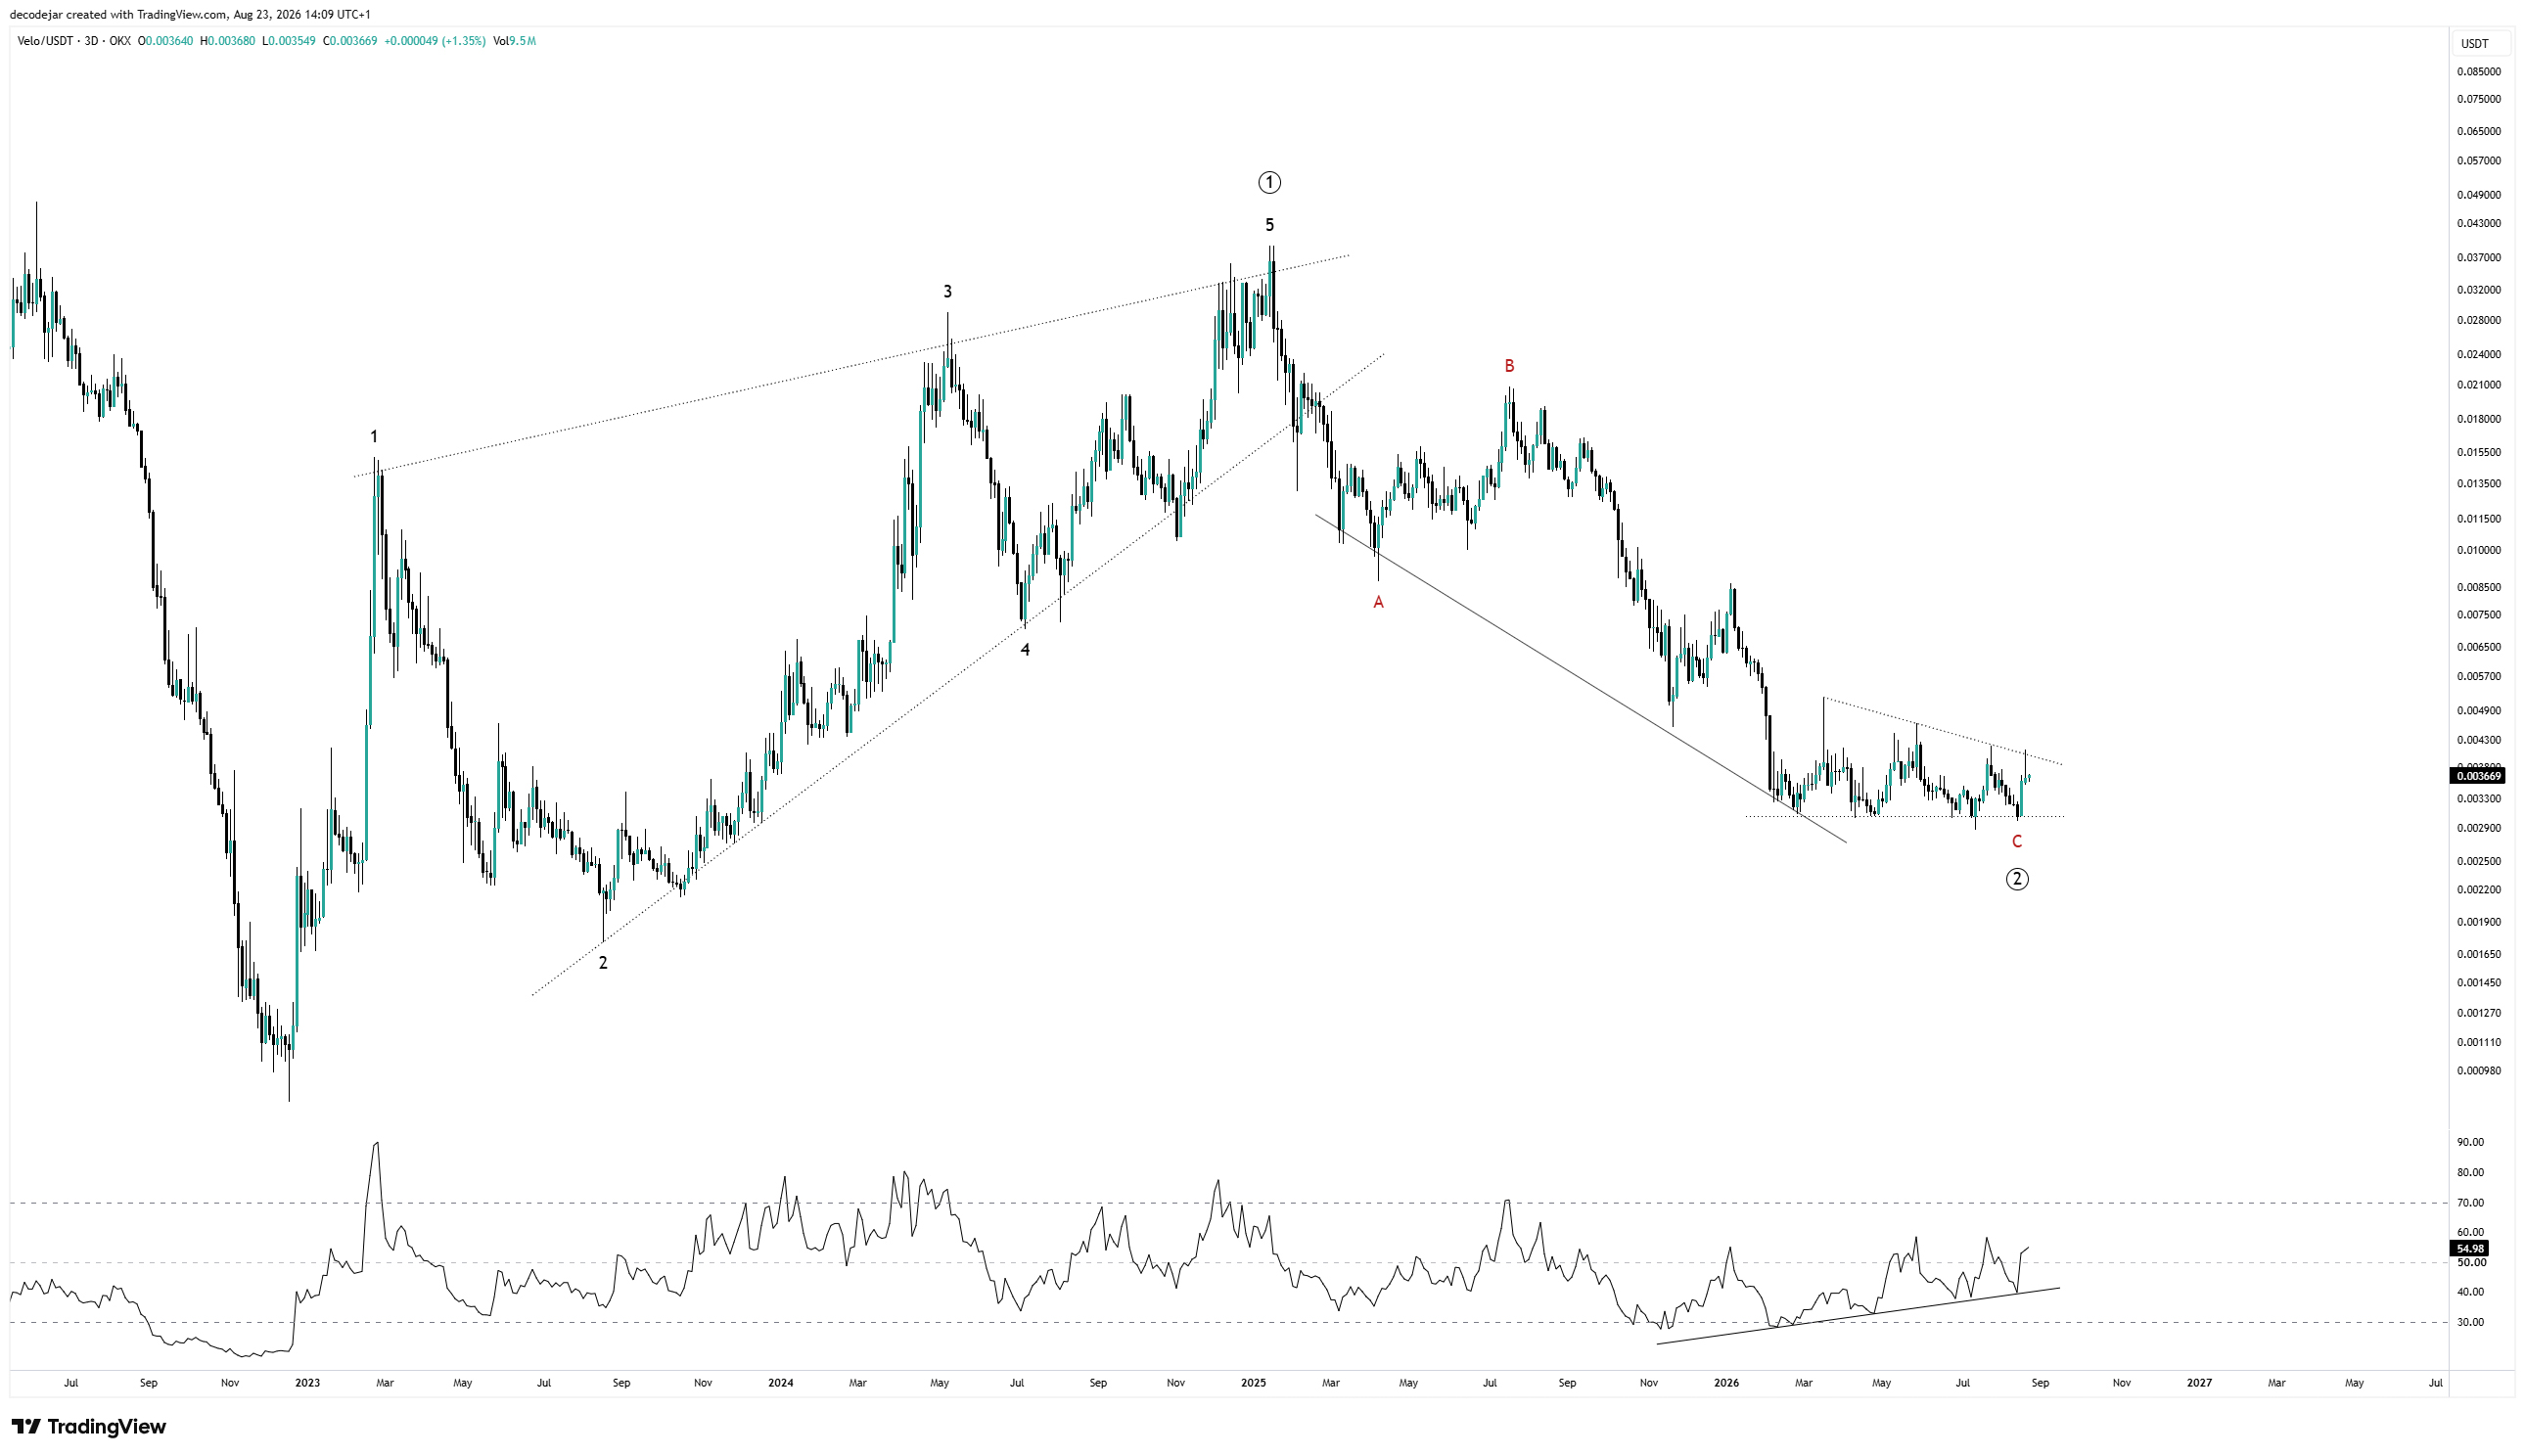
Overall, like SUI, I can't be sure if this has bottomed, however when we look at the overall positioning of the market and just how far down the risk curve a microcap like VELO lives, it's not surprising that it is still showing some relative weakness. I personally see this simply as an extended opportunity to get long when a large cap like Ethereum is already up more than 60% off its June low.
Closing Thoughts
Well this was supposed to be a quick update considering the last one only went out a week ago, but in the end I felt there was quite a lot to cover.
Over the past 6 months, the lag between the business cycle expansion and this potential reversal candle on Bitcoin has certainly made me question whether I was looking at the right things. Of course there are never any guarantees in the markets, and I could still be wrong, but the way the current weekly candle on Bitcoin has blasted through resistance gives me a great deal of confidence that this reversal is real. While we still need to see a macro higher high with a reclaim of 82.8k, I am given additional comfort in seeing that Ethereum has already cleared its equivalent level.
The positioning of the business cycle and the uptick in liquidity, alongside the fact the energy crisis appears to be behind us, finally opens the door for the crypto market to rise. In terms of cycles, I think that at 10.5 months down, it makes little sense to throw the 4 year cycle out entirely, even if I do see it more as a simplification, and likewise with the business cycle picking up 6 months ago, it also still has to prove its worth.
My current position is that both cycles are real, but the business cycle is the one doing the work. The 4 year rhythm either comes along with it to reinforce a strong Bitcoin cycle, or pulls against it for a weaker one. Whether this is a late-cycle blow-off or the beginning of a longer and more durable trend is something we can only know in hindsight, but today the timing of this breakout favours the former.
In future editions we will continue to track all outcomes, and be flexible in our approach to analysing the market, but for now at least this Bitcoin breakout is extremely welcome relief. With a high probability low in place, we will also continue the theme of looking more closely at crypto itself, not just its macro context, and slowly work our way through a number of popular projects and crypto native topics over the coming weeks and months.
That’s all for this issue; as always thank you so much for subscribing to the Decode Newsletter, and stay safe out there.
Disclaimer: This content is for informational and research purposes only, reflects the author’s opinion, and is not financial, investment or trading advice. The cryptocurrency market is volatile; invest at your own risk and only what you can afford to lose. Past performance does not guarantee future results.